Rainfall data Analysis Using ARC/GIS
GIS software can be used to generate rainfall data to detect the change in annual precipitation. This spatial rainfall data can also be used as input data in different simulation models such as hydro-logical modelling, runoff modelling etc.
Rainfall data collected from rainfall data collection center and usually there are three to four rainfall stations in a city but for simulation models one requires continuous data/layer. Therefore GIS functions allow to generate continuous layer of rainfall data which can be used for simulation.
Daily rainfall data was collected from the ground water reports of Rajasthan for six rainfall stations namely Chaksu, Phagi, Sanganer, Mozmabad, Tonk and Malpura. These are located in and around the Phagi tehsil, thereafter location of these rainfall station were plotted in ArcGIS.
Spatial analyst tool of ArcGIS software was used for data interpolation. Rainfall data were interpolated using inverse distance weighted (IDW) method. In the IDW method, it computes a value for each node of grid by investigating nearby data points that comes within a user defined radius. For data interpolation you need to follow these steps:
Click on Arc Tool box then Click Spatial analyst Tools followed byInterpolation.
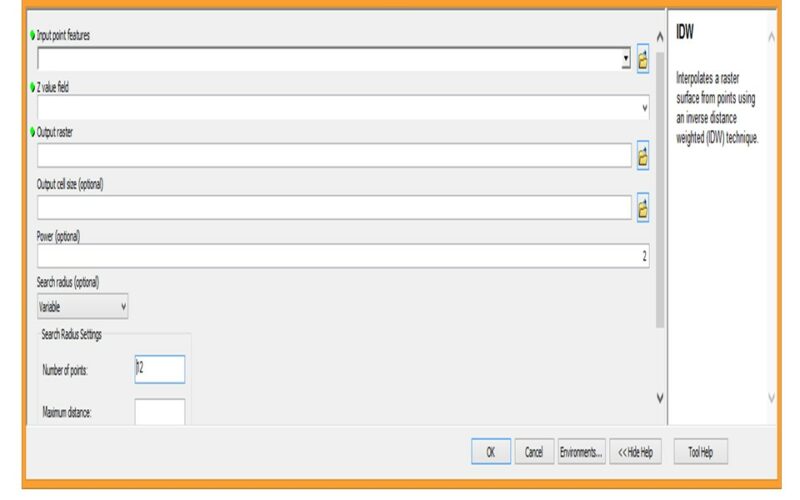
Now you have to click on IDW then following window will open
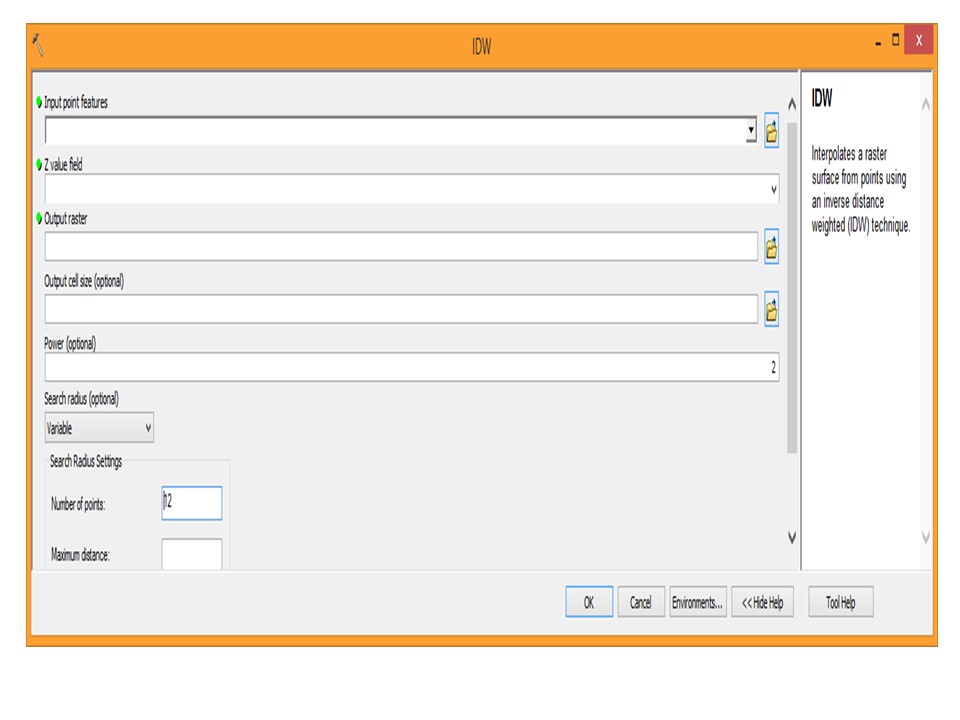
Here you have to define the input point locations of rainfall stations, Z value i.e. Rainfall data and output file name.
Once you got the interpolated data of your study area then you can calculate zonal statistics by clicking on Zonal followed by Zonal Statistics as table. Following window will pop-up
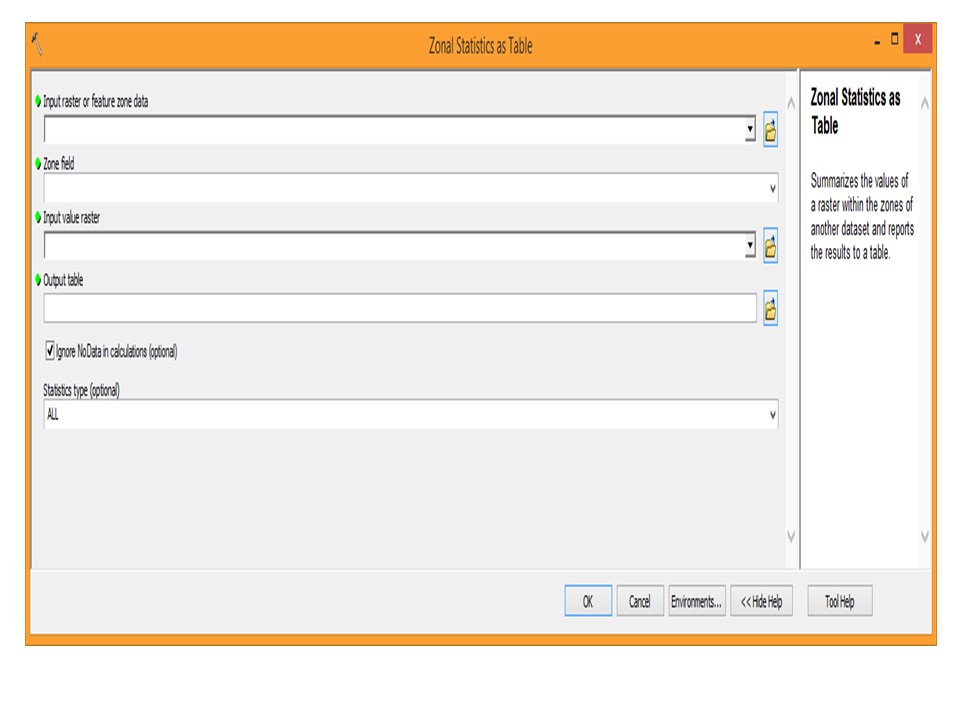
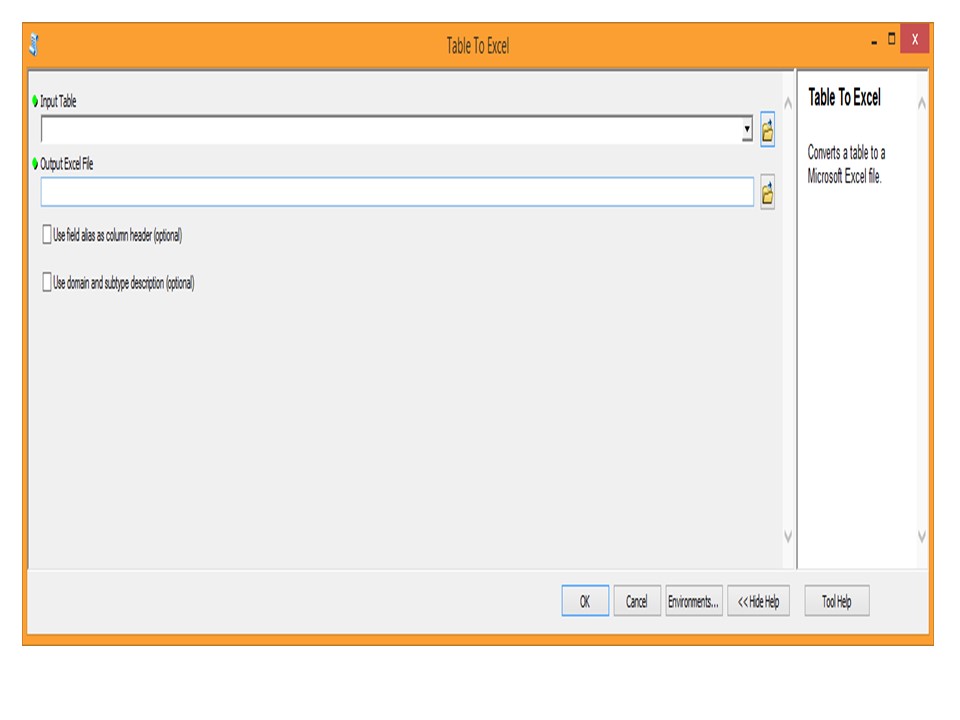
Define the inputs and outputs, then you will get the values such as Min, Max, Mean, Median, standard deviation etc. for each zone of your study area. Now you can also convert this output table to Excel by selecting Excel followed by Table to Excel in Conversion Tools.
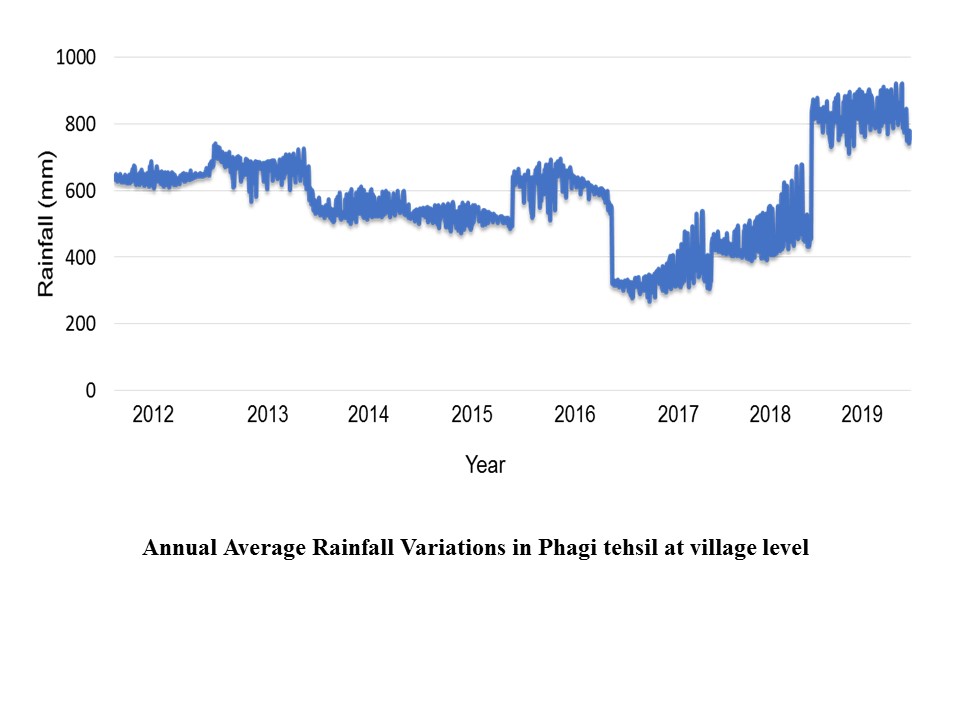
In this way the rainfall data and ground water level data of pre-monsoon and post-monsoon period was interpolated for entire Phagi tehsil at village level for eight years i.e. from 2012 to 2019.
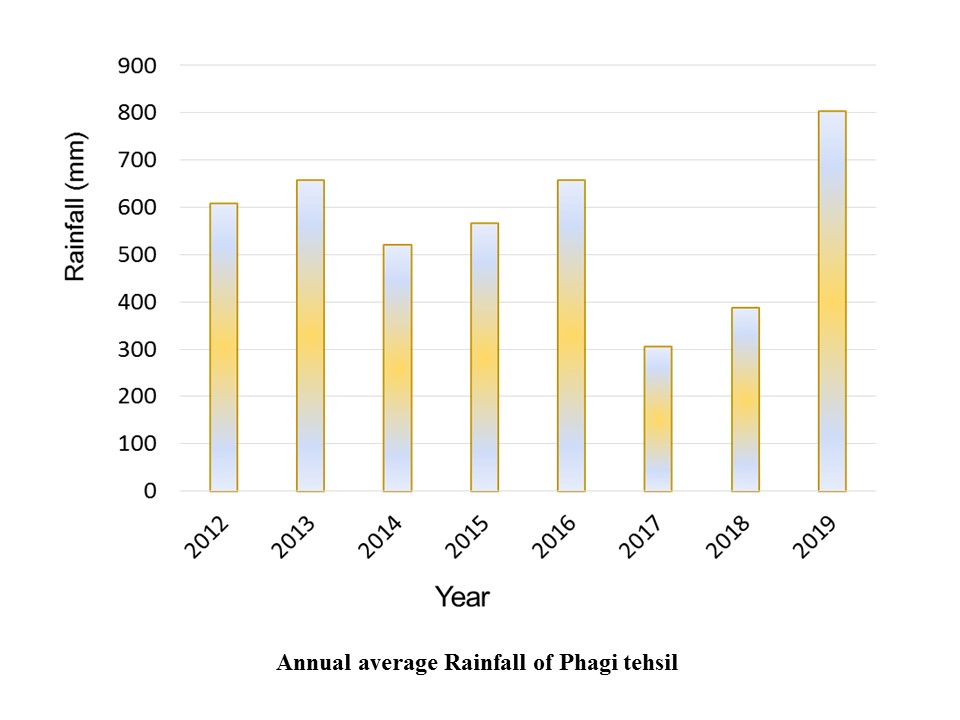
Using Zonal statistics tool of ArcGIS, the minimum, maximum and average values of rainfall were calculated for 171 villages of Phagi tehsil.
I love nature very much and I like to rental exotic cars and drive around national parks. I love nature and everything connected with it – the weather, the surrounding environment and much more.