Location of Government Schools in Phagi Tehsil
Locations database mapping play very important role in management and allocation of resources as well as to find the proximity of resources for better management. Location based data allow to measure distances between spatial feature whether natural or man-made.
These location data also allow establishing relationship between spatial features through proximity analysis process in GIS. One can find the impact of availability of amenities on urban growth or find the impact of pond on changes in agriculture activities in study area.
Location database are very commonly used by different app or websites such as food delivery apps to locate the delivery destination and tracking, cab services apps to locate cab and to find and tracking cab and different map based apps and website to find location of all the man-made feature for example, hospitals, schools, shopping mall/shops, public and private offices etc. By using these locations, one can measure the distances between two locations as well as can estimate the travel time based on the data.
Location data can be generated by many ways, the most commonly used method through the GPS survey. BY using this method the coordinate information of the location is collected using GPS. The coordinate (latitude and longitude) information can be collected in different formats such degree decimal, degree minute second and meters etc.
This collected coordinated information can easily import in GIS software. Instead of this, these coordinates information can be created in excel file and then imported in GIS software. BY using the create points/location tool of GIS to generate location layers.
These generated points/locations in GIS software will also have non-spatial or attribute information, which is collected during the GPS survey. This attribute information can also attached with these location for further analysis. The attribute information can be collected to different levels of any known location such as just type of location like hospital, school; office etc. and this information can be further collected as per requirement: for example in case of hospital; such as name of hospital, category of hospital, bed numbers, facilities etc. can be collected for the hospital.
These collected attribute information can be integrated with location database generated in GIS, which can be further used to analyse the impact assessment, monitoring and management of resources and their relationship with location based factors.
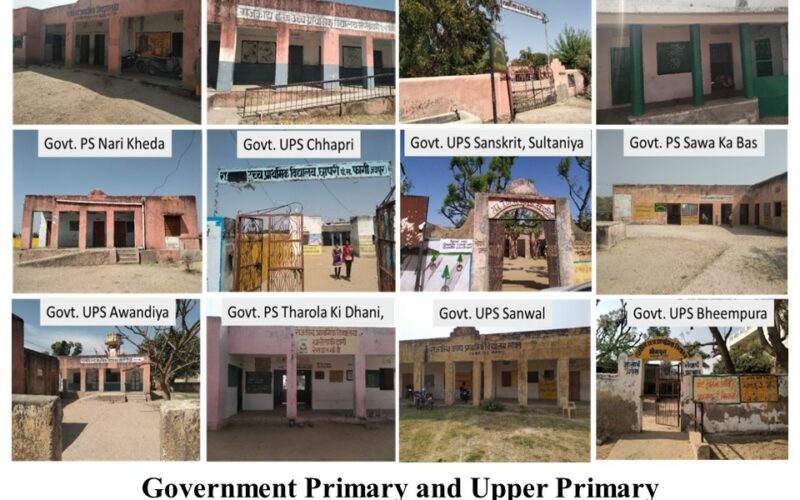
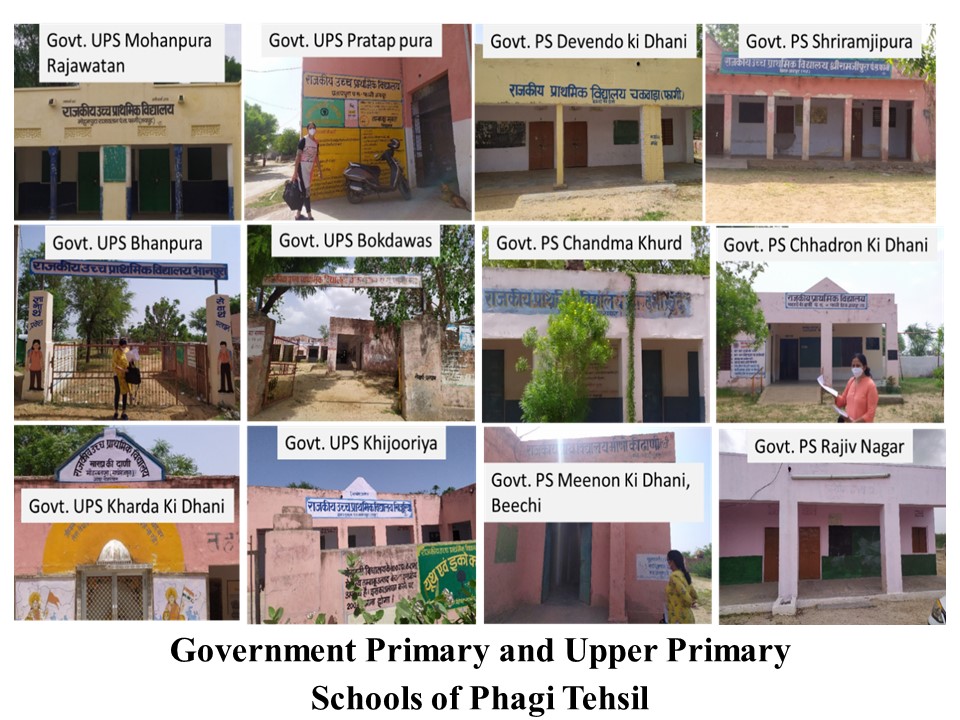
Images of some of the government primary and upper primary schools are shown below.

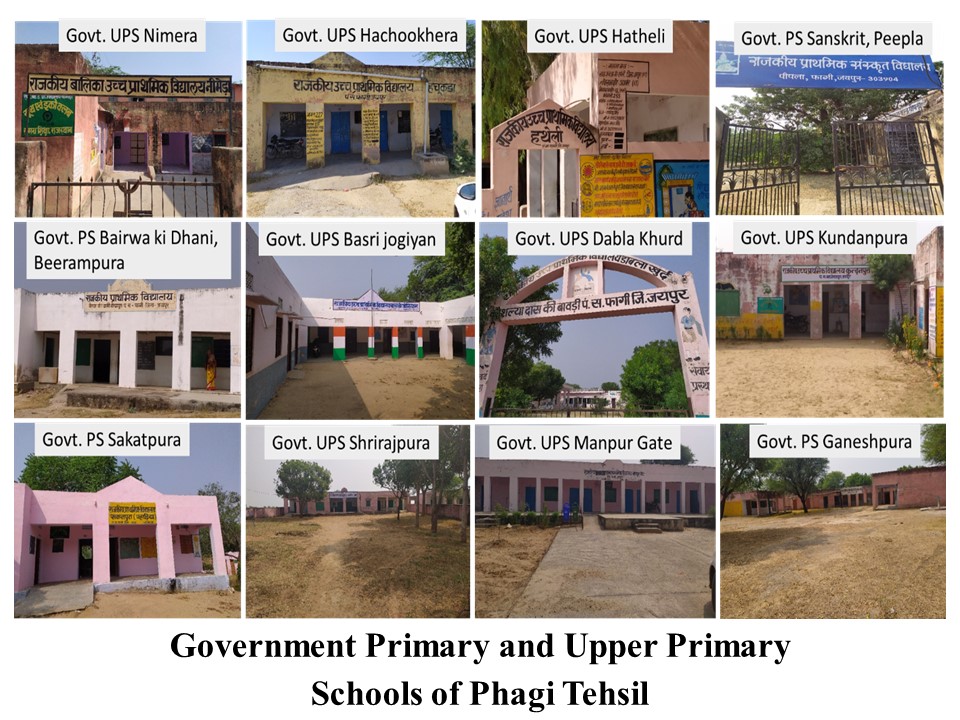
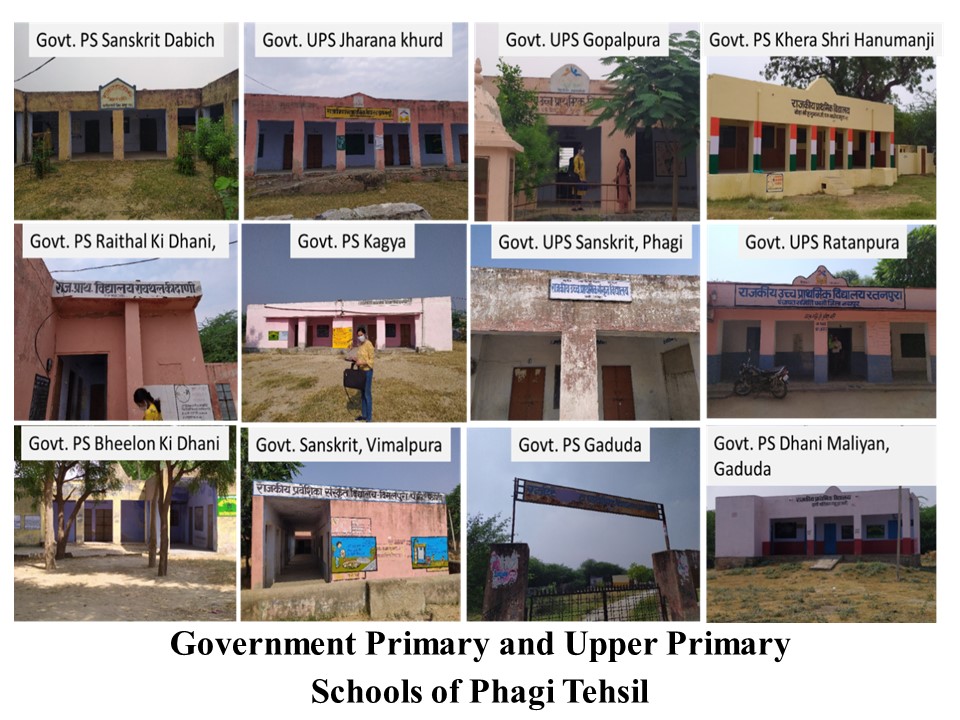
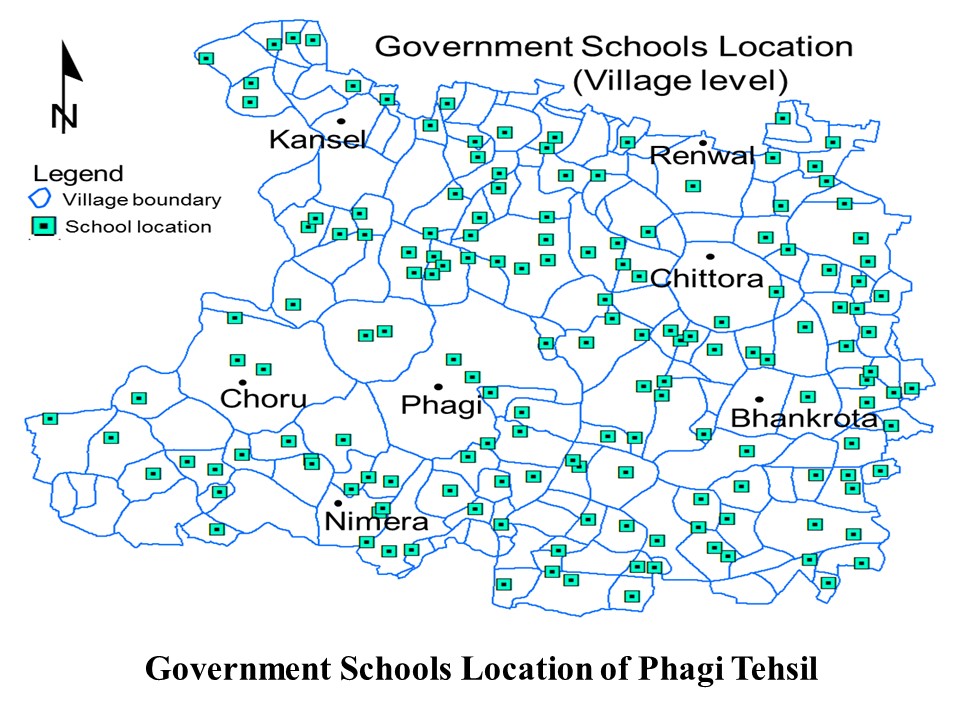
In this article school location maps of Phagi tehsil were generated using GPS based survey of each school. Therefore physical survey conducted for each school of Phagi tehsil to collect coordinates and other information of schools as attribute data. These schools were surveyed to know the physical condition, basic facilities and other details.
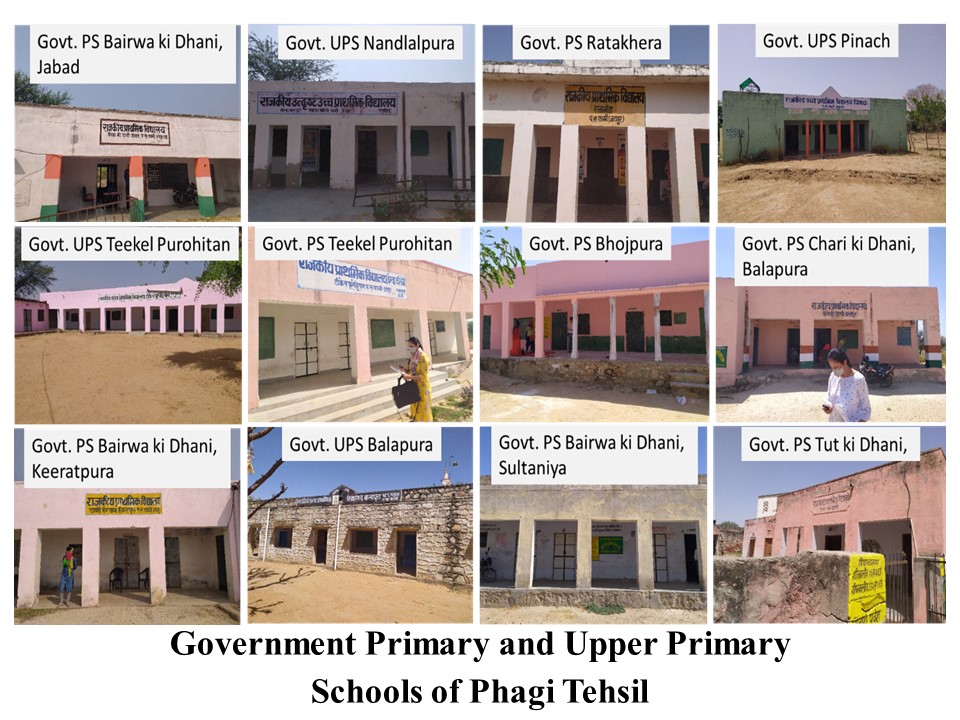

The location of Government Primary and Upper primary Schools at village level in Phagi Tehsil were determined using GPS based survey and plotted in GIS environment. A total of 164 Primary school (PS) and Upper primary School (UPS) locations were collected in 171 villages of Phagi tehsil.
For study we have considered PS and UPS government schools because, these are lacking the infrastructure facilities such as boundary wall, toilets, drinking water facility, hand wash facility, playground and water storage facilities. However at some places the school building is also very old.

In order for the part to be packed out, there have to be enough molten plastic remaining in front of the screw have the ability to|to have the flexibility to} switch the Hold Pressure through the runner system and through the molded part. Phase 4–cooling and plastication–is usually the longest {part of|a best plunger for toilet part of} the molding cycle–up to 80% of the cycle time. Optimizing cooling time can yield substantial positive aspects in productiveness. Because the gates are sealed during this section, cooling temperature and time are the only variables at work. The key to optimizing the cooling section is to balance the need to cool quickly against the amount of molded-in stress the final part can face up to. In addition to conformal cooling, the latest introductions of high-thermal-conductivity mould coatings and materials have further enhanced the chances and efficiencies of the hot/cold molding course of.