Groundwater Level Scenario Analysis using GIS-Phagi Tehsil (2012-2024)
Erratic rainfall, squeezed rainy season, increase in impervious layer etc. have affected the demand and supply of water in the village/city/district/state. Therefore dependency on groundwater is increased a lot for drinking, agriculture, and other usage in day-to-day life. Due to this groundwater is too exploited and most of the areas/locations in India as well as in Rajasthan became dark zones. This groundwater demand will increase in the future as the population is growing rapidly. This will affect the groundwater quality and which leads to disease and health issues of human beings. Therefore authorities need to regularly monitor the groundwater condition as well as plan accordingly to efficiently use groundwater.
GIS plays important role in database generation, especially in the spatial format of both raster and vector. If the same monitoring and mapping of groundwater performed using GIS will take less time and be cost-effective. It will also reduce the redundancy of data and data can be easily integrated with existing data or models. GIS can also be used to predict the future condition of water levels in any specific area.
Therefore in this article, groundwater level mapping using GIS is demonstrated based on the case study of Phagi.
Pre-monsoon and post-monsoon groundwater level and groundwater quality data from the years 2012 to 2019 were collected from State Ground Water Department, Rajasthan for different sampling locations of Phagi tehsil.
The sampling locations were wells, bore wells, and hand pumps. The spatial analyst tool of GIS was used for analyzing spatial and temporal trends of groundwater level and groundwater quality.

Ground Water Level Analysis
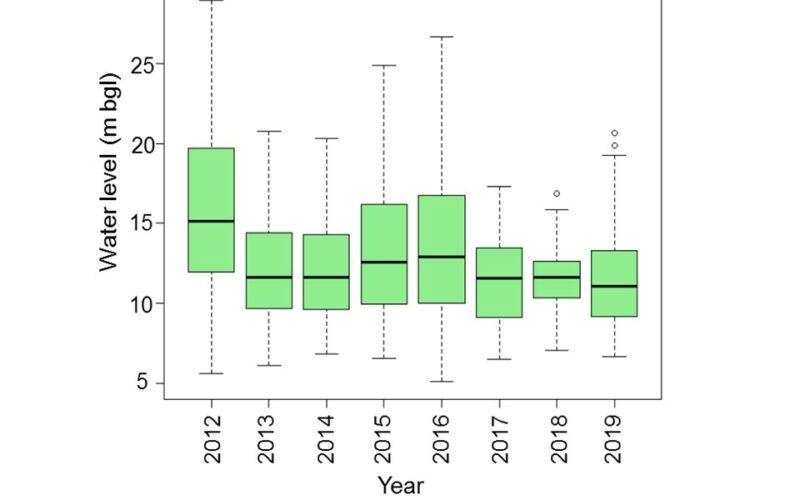
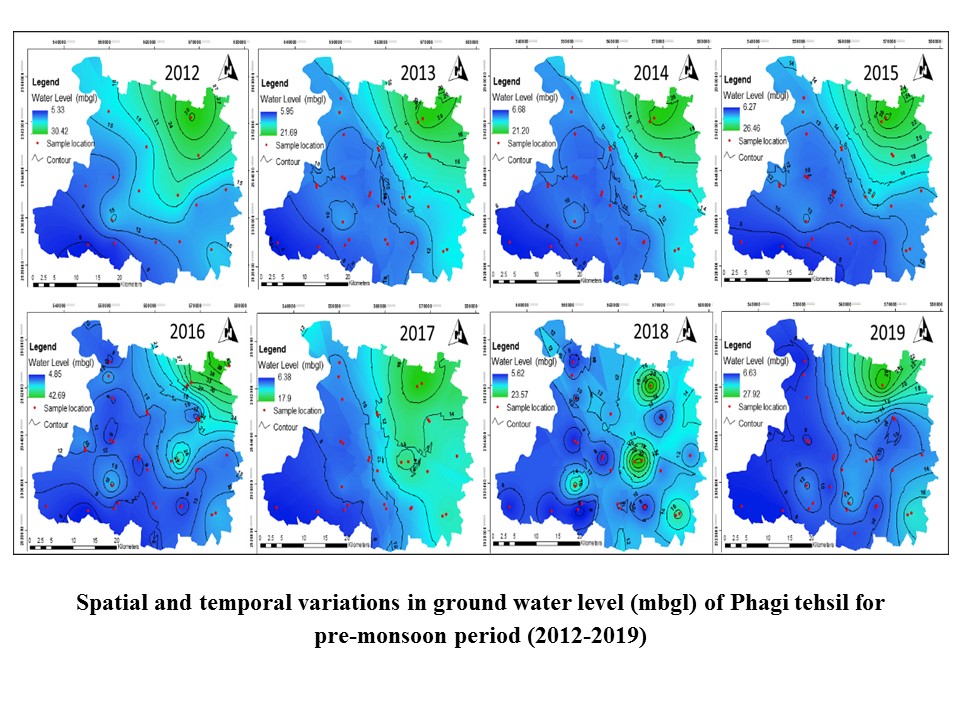
The ordinary kriging technique was applied to interpolate the eight years (2012 to 2019) of groundwater level data. Kriging is an unbiased point interpolation method, which requires a point map as input and returns a raster map with estimations. The advantage of Kriging above inverse distance weighted (IDW) method is that it provides a measure of the probable error associated with the estimates. The spatial and temporal variation in groundwater level could be seen in the figure given below.
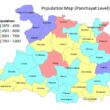
By applying the Zonal statistics tool of GIS, one can calculate the groundwater level at the panchayat or village level. The zonal analysis is an important raster-based analysis tool of GIS that could be used for different GIS-related studies viz. demographic studies, surface modeling, environmental monitoring, planning and design, land management, etc. This tool creates an output raster or statistics table from the input value raster that intersects or falls within each zone of a specified input zone dataset.
A single output value is computed for every zone in the input zone datasets. The comparative spatial and temporal analysis of Phagi tehsil at the village level is shown below figure.
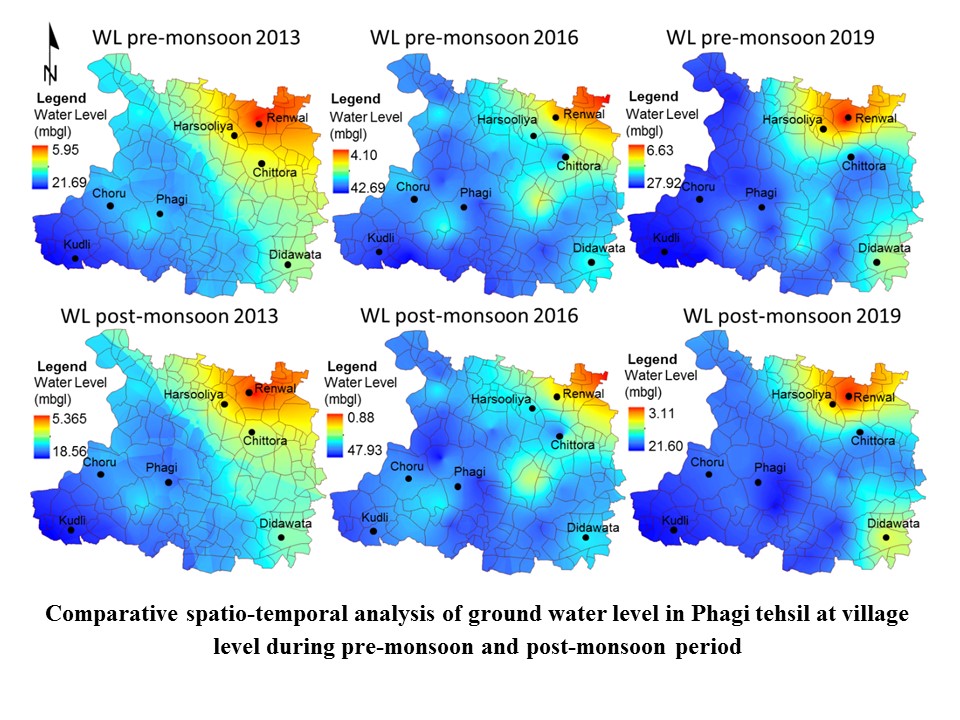
The groundwater variations indicate that the water level is directly affected by the rainfall as the maximum water level depth decreased from 2016 (42.69 mbgl) to 2019 (27.92mbgl). However, the minimum depth of groundwater is increasing from 2013 (5.95 mbgl) to 2019 (6.63 mbgl) and the deeper water level is observed in the northern part of Phagi tehsil such as Renwal, Harsooliya villages.