Air Pollution become threat to daily life as already faced severe attack of pollution in New Delhi and its surrounding. Population and increase in transportation system specially vehicle growth playing significant role in increasing air pollution. As well as built-up growth in the form of development also affecting and increasing pollution.
Factors Affect Air Pollution
Population growth and in-migration of poor people influence the urban centers. Increasing pressure on land and other resources in the form of industrial and commercial development. urban sprawl is seen as one of the potential threats to pollution and many more.
Here in this article demonstrated that how GIS and remote sensing can be used to find the affect of urban and population growth on air pollution of a city and described with real data analysis.
Local pollution patterns in cities are mainly related to land use category, transportation network, and air flushing rates. Here in this study, an integrated approach of remote sensing and GIS was applied to ascertain the relationships among spatial variables such as impervious area, land consumption rate and temporal variations in gaseous and particulate pollutants within an urban context.
The air quality of an urban area is mainly influenced by human activities. Therefore, the understanding of relationship between air pollutants and urban characteristics is quite important.
Data Collection:
Acquired satellite images and air pollution data of different station located in the city.
By this, different layers and database need to create such as impervious surface or built-up is considered as the key parameter for quantifying the urban sprawl. This impervious area is largely contributed by use of materials like concrete, bricks, tiles etc. for buildings and bitumen for roads and parking lots.
The phenomenon of accelerated urbanization is the main factor responsible for increase in impervious area and deterioration of overall quality of the city environment.
An increasing concentration of human population and their activities in urban areas produces air pollutants with higher rate as compared to less-developed areas and natural environment.
For assessment, the air quality data of gaseous air pollutants viz. sulfur dioxide (SO2), nitrogen oxides (NOX) and particulate air pollutants viz. suspended particulate matter (SPM) and respirable suspended particulate matter (RSPM) or PM10are collected.
Impervious area dynamics
Impervious area growth is estimated using satellite imagefor Jaipur city. Growth is estimated for different period to find the changes in impervious area. The interpretation of classified images implies that the land development in Jaipur region is at excessive rates during 2008 to 2013.
The impervious area is also correlated with population for further analysis.
The land under impervious area in 2008 was 11,855.9 hectares, which grew to 17,565.7 hectare and 20,734.6 hectares in year 2011 and 2013 respectively.
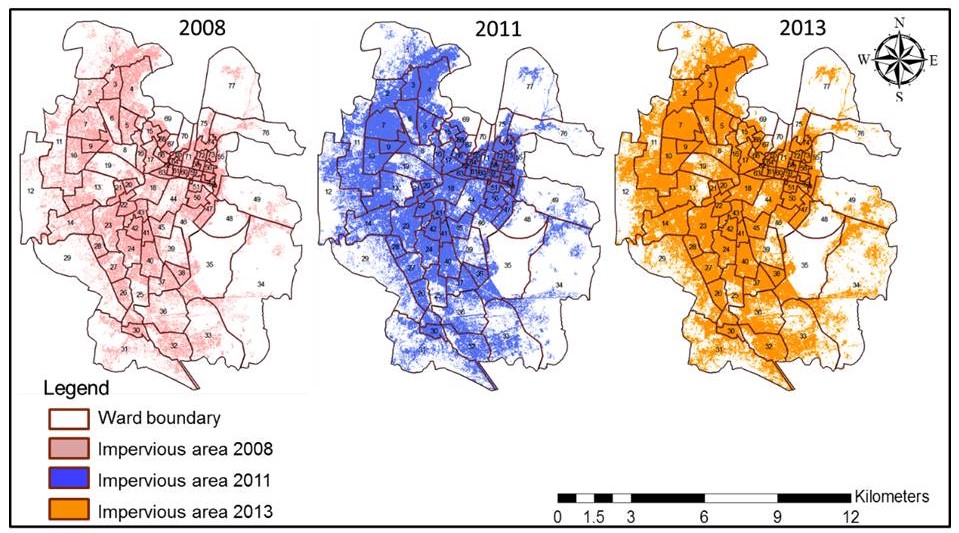
Fig. 1 Spatial and temporal changes in impervious Area
Between 2008 and 2013, the population in the Jaipur city grew by about 14.85 % (Census of India, 2001 and 2011) while the amount of impervious area grew by about 74.89 %, or nearly five times the rate of population growth.
This accelerated growth in impervious area clearly indicates that per capita consumption of land has increased exceptionally within five year period. The per capita land consumption refers to utilization of all lands for development initiatives like the commercial, industrial, educational, and recreational establishments along with the residential establishments per person.
The increase in impervious area over the years (2008-2013) has been calculated for Jaipur city at ward level.
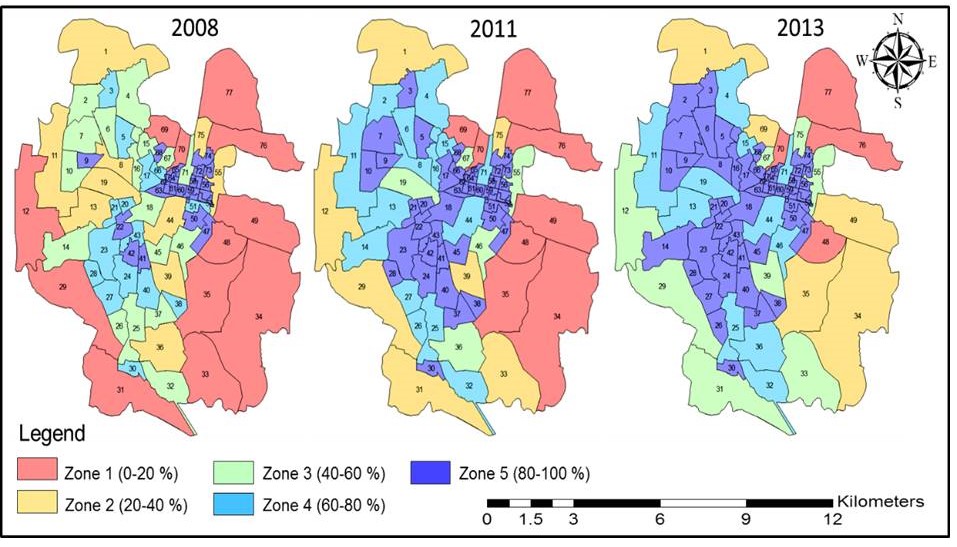
Fig. 2 Spatial and temporal changes in impervious Area
The impervious area growth is categorized into five different zones for the ease of analysis. “Fig. 2” depicts the zonal distribution of impervious area (in %) for Jaipur city region. Results clearly indicate that there is tremendous increase in number of wards under Zone 5 (impervious area 80-100 %) category from 2008 to 2013.
Fig. 2 Zonal distribution of Impervious Area (in %) in different wards of Jaipur Spatial distribution of all pollution factors using GIS. In this process air pollution data collected from all monitoring center and spatial analysis performed to create spatial and non-spatial database in GIS.
Fig. 3(a) and 3(b) reveals the spatial distribution of annual average NOx concentration and annual average SO2 concentration with respect to impervious area during the study period (2008-2013).
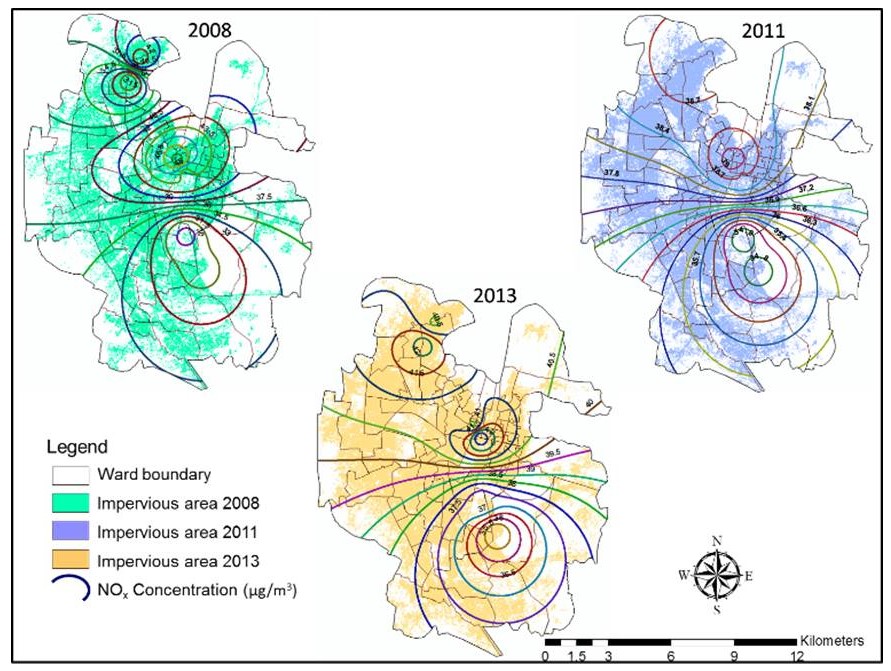
Fig. 3(a) Spatial distribution of Annual Average NOx
NOx and SO2 contour lines clearly indicate the higher values in wards with more impervious area and lower concentration in wards with less impervious area or more open spaces. Results show the higher NOx and SO2 values at industrial area and city center area.
Yearly trend of NOx and SO2 indicates that rise in the concentration of these pollutants during 2011 and 2013 was lower in comparison to 2008 concentration.
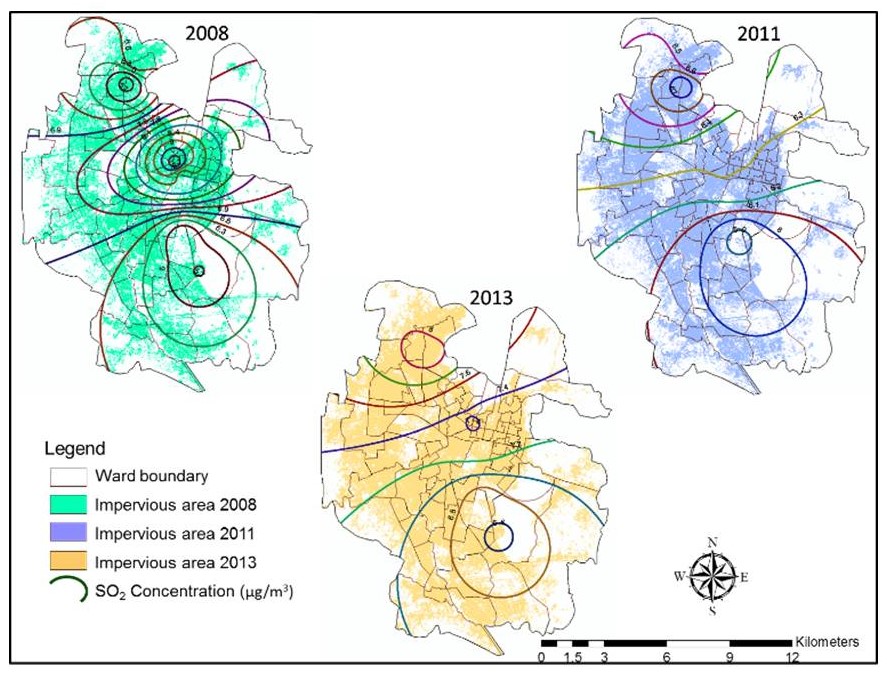
Fig. 3(b) Spatial distribution of Annual Average SO2
“Fig. 3(c) and 3(d)” indicates the spatial distribution of annual average SPM concentration and annual average PM10 concentration with respect to impervious area during the study period (2008-2013).
The contour lines for particulate matter (SPM and PM10) infer the increasing trend with rise in impervious area during 2008-2013.
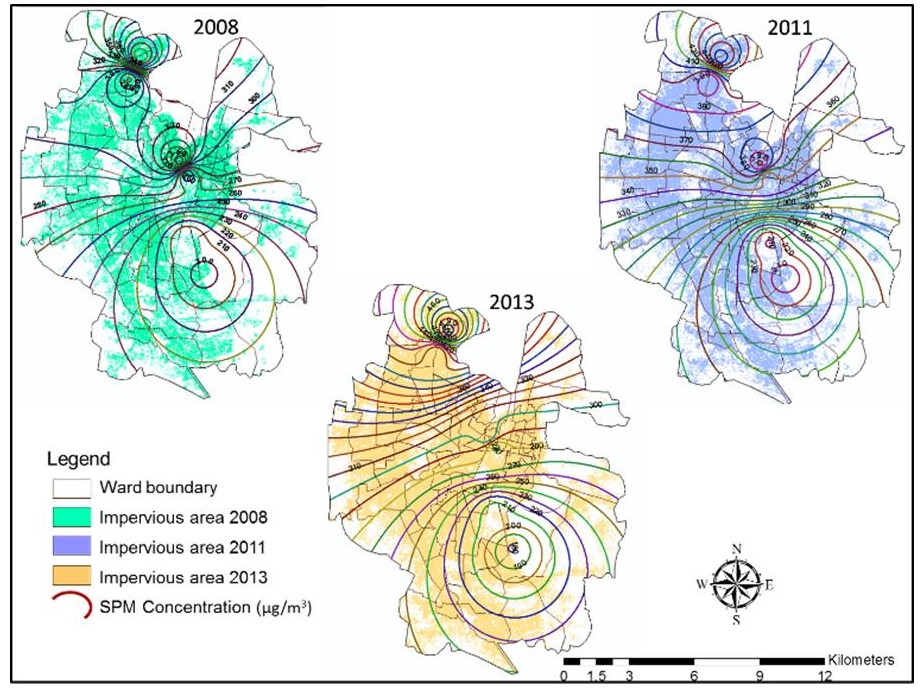
Fig. 3(c) Spatial distribution of Annual Average SPM
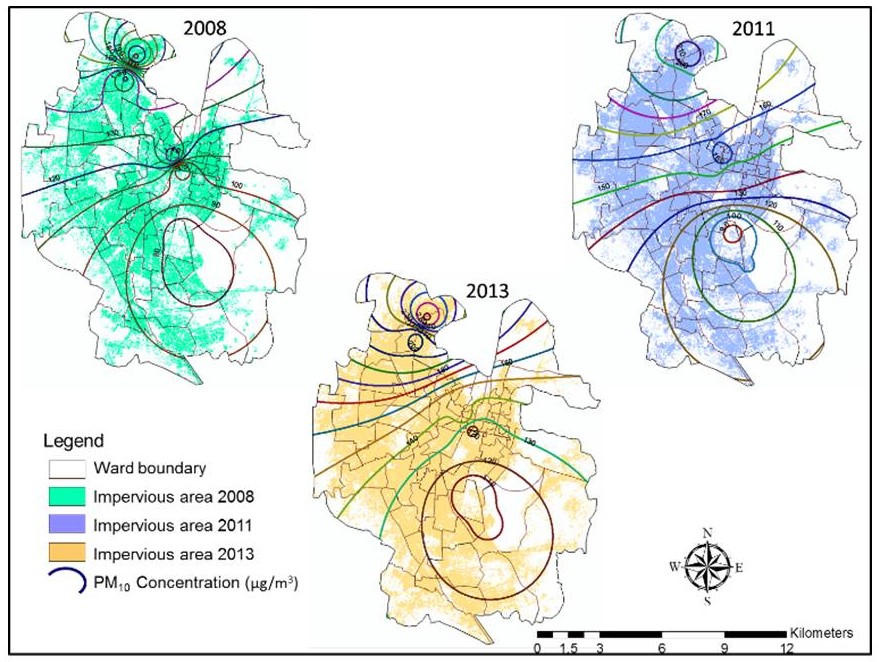
Fig. 3(d) Spatial distribution of Annual Average PM10
Although particulate pollutants concentration is high in most of the wards of the Jaipur city but highest concentration was observed in industrial area and city center area. While lowest concentration was in areas with more sub urban area. This implies that air dispersion rate is more in low land use density areas in comparison to congested city areas.
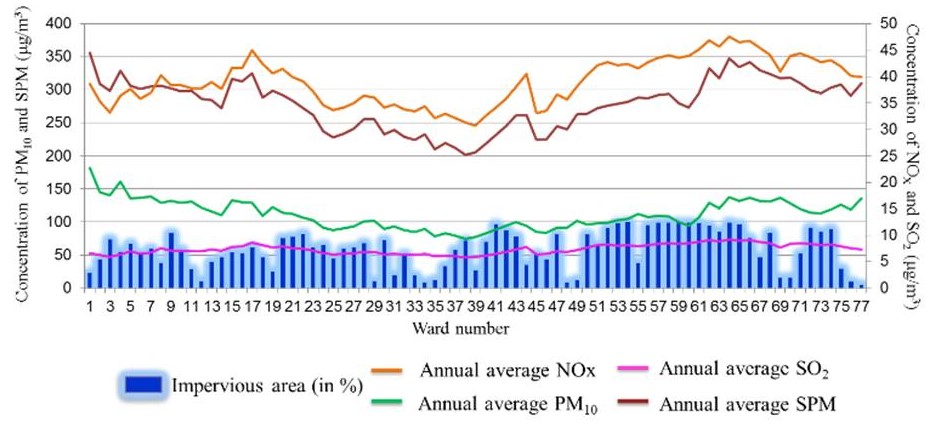
Fig. 4(a) Air pollutants (in μg/m3) pattern with impervious area in 2008
“Figs. 4(a), 4(b) and 4(c)” indicates the pattern of different gaseous (NOx and SO2) and particulate pollutants (SPM and PM10) with changes in impervious area in year 2008, 2011 and 2013.
Similar pattern was observed for NOx, SPM and PM10 with rise and dip in impervious area, however, no significant changes were found in SO2 with respect to impervious area.
These figures (4a, 4b and 4c) infer that the wards with higher coverage of impervious area are potentially unhealthier in term of the air quality than the area with less coverage of impervious area.
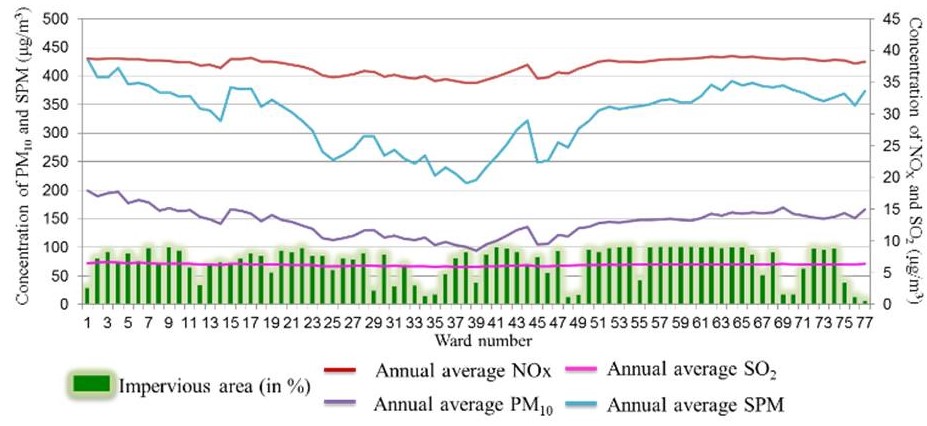
Fig. 4(b) Air pollutants (in μg/m3) pattern with impervious area in 2011
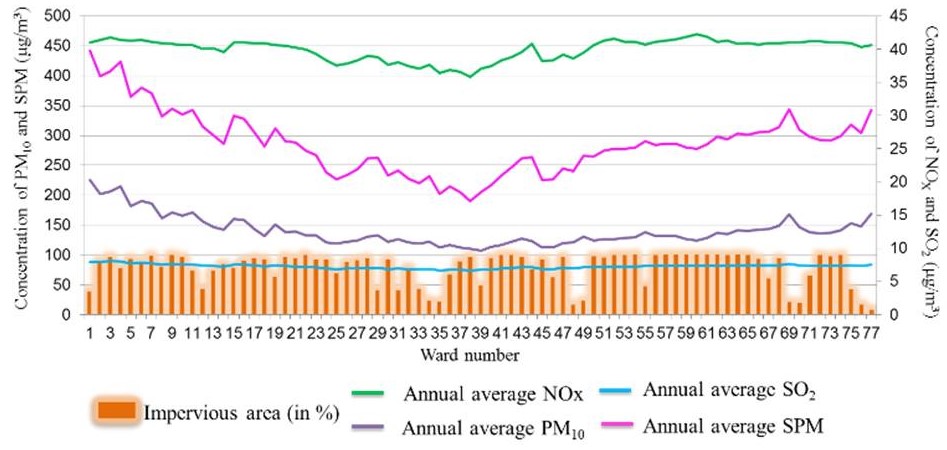
Fig. 4(c) Air pollutants (in μg/m3) pattern with impervious area in 2013
The above analyzed data define that how GIS and Remote sensing can be used to monitor and also to find the variables affecting air pollution. This information can be used by policy makers, researchers and students to conduct such methods for air pollution studies etc.