Remote Sensing data or images can be used to assess past trends and current status of natural as well as man-made features on earth surface. Satellite images can be acquired based on need and using image characteristic/properties such as Spatial, temporal and spectral resolutions to create spatial data in the form of land use/land cover maps.
GIS is used to create other spatial data such as road network, proximity to central business district etc. The spatial data can be created in both raster and vectorformat including non-spatial data in the form of attributes for scenario based analysis.
These data can also convert from raster to vector and vice versa as per need using image processing and GIS software. These spatial data can be integrated to assess the changes in future based on some specific condition and constraints.
As GIS allow to incorporating mathematical and simulation models, it is become easy to use these spatial data for assessment based on certain condition, which can be called as scenario based study.
Case Study to Understand the Scenario Analysis
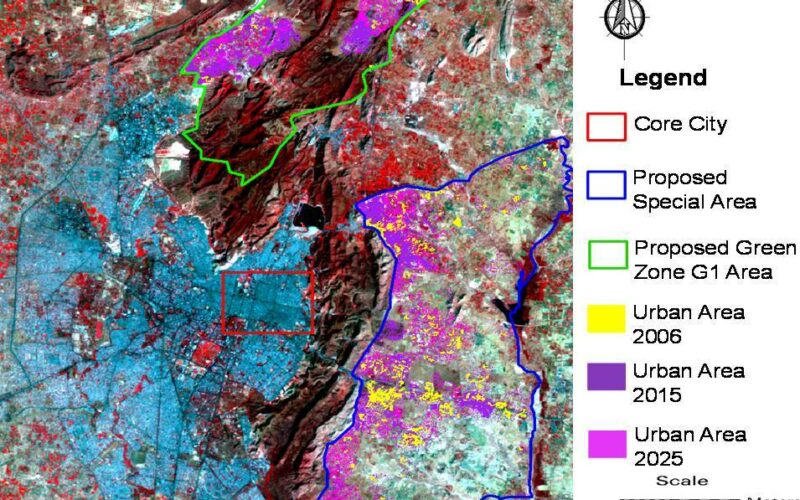
This scenario was generated to ascertain urban change in terms of the cause and consequences of a time gap in planning and implementing policy, particularly with respect to government policies. For this analysis, a proposed land use plan is used, which was prepared by local development authorities in 2010 under Jaipur city’s master plan of 2025.
The local authority demarcated a land use class, i.e., a special area in this proposed plan, which is located in the eastern part of the city at 7km distance from the core city. This land use class is defined as Naya (New) Jaipur, which covers 10,500 hectares of land area for the development of a new township.
According to the primary source of information, Master Plan 2025, the existing structures in that area will be retained after the implementation of this planning policy, but further unplanned development will be restricted.
However, an important requirement in this planning is the need for an entryway to the special area from the core city. The local authority is planning a 4 km long tunnel to that area and expects the tunnel will take five year to complete according to a primary source of information.

Figure A. Proposed Special Area and Green Zone in Master Plan of 2025 with Change in Urban Area
The major cause of high growth in respect to the simulated data is the two main highways passing through from both sides of this zone. Urban changeis very important for this zone and it is essential to understand how to control this sprawl.
The results of policy analysis indicate that simulation and prediction modeling are very significant to understanding the dynamics of urban change patterns in the future.
thank you for your blog. Your blog is very informative and provides me the best content. I've visible a website that provides me Raster To Vector Services offerings at a low budget my revel in was suitable.
I am really happy to say it’s an interesting post to read .I learn new information from your article , you are doing a great job . Keep it up.BusinessClue is a Guest Posting Blogsite that providing all over world business especially guest posting in Europe like news,
Health Sector, Finance, Corporate Laws, Sports, Entertainment, Fashion etc.
I'd like to express my gratitude for writing such an informative piece on this blog aboutTechnology Planning for Small Business. This article provided me with a variety of data. Continue to post.
raster to vector service is a service that helps you convert your digital graphics into vector illustrations. With our easy-to-use tools, you can create beautiful illustrations in just a few minutes. We offer a variety of templates and professional services, so you can be sure that any design project will look great.