This article is in continuation of last article in which remote sensingand GIS used for spatial analysis to assess and prospects of future scenario in urban change. In the below article another case is discussed in which effectiveness of proposed plan of 2025 for city is assessed using remote sensing and GISbased spatial analysis process.
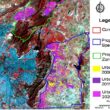
Through remote sensing, one can acquire satellite image of different periods or multi date as well as from high resolution to medium resolution and also combination of bands or multi spectralor panchromatic band.
In current there are many choices are available related to acquiring of satellite images. This may help user to create spatial data from high resolution to medium resolution as per need and also for different periods like from last 10 or 20 years to ascertain the change and trend of urban sprawl.
The basic and important steps of digital image processing such as layer stacking, subset, mosaic, enhancement, interpretationand classification are used to create spatial data using satellite image.
GISis a versatile tool as it has vast application area and allow incorporating secondary data by supporting most of the data formats. GIS not only help user to create spatial data as well as analysis by integrating different tools and mathematical models and concepts. GIS functions and tools can be used to create different second level data such as proximity to river, distance from road and distance from urban center etc.
These spatial data can be used as direct input to simulation models for further analysis. GIS and remote sensing software are competent enough to create spatial data in raster as well as vector data formats.
Case Study Scenario Analysis based on Land use Plan and Policies
The Jaipur city authority has proposed a land use plan for 2025 in its master plan. This proposed land use indicates the future demarcated and designated areas for different land use classes such as residential, commercial, institutional, and industrial.
The aim of this scenario is to ascertain the growth pattern in the areas allocated for residential, commercial, and industrial use in the proposed land use of 2025 by using estimated data of 2006 and simulated data for 2015 and 2025.
The estimated data of 2006, simulated data of 2015, and simulated data of 2025 have been extracted from a proposed land use map of 2025 for all three of the above categories.
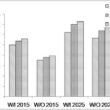
In this scenario, landscape metrics are integrated in GIS for spatial analysis and to assess the change and impact on future development. The landscape metrics have been calculated including Edge Density (ED) and Area Weighted Mean Patch Fractal Dimension (AWMPFD) for all three periods.
The ED of the residential class shows enormous increases during both 2006–2015 and 2015–2025 from actual urban data of 2006 to simulated urban data of 2015 and 2025. This indicates an increase in new residential patches, which implies high growth in residential areas.
The ED of commercial areas also indicates a continuous increase from actual data to simulated data during 2006–2025.
ED was close to 1.7 in 2006 and will reach 5 in 2025 for commercial patches. The ED of the industrial class will double, which indicates enlargement of the industrial area during 2006–2015. ED in 2025 will decrease compared with 2015, which indicates the increased density of industrial areas (Figure a).
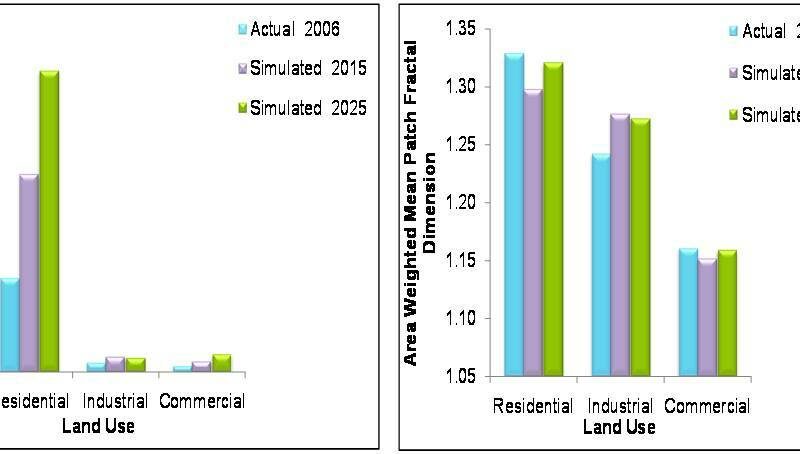
AWMPFD has also been measured for all these categories to ascertain the complexity of these classes. AWMPFD for the residential class is decreasing from actual urban data to simulated data during 2006–2015, which indicates that the residential area is moving toward the more regular shape of urban areas.
However, AWMPFD during 2015–2025 is increasing, which implies that the complexity of the residential area is increasing and its shape is becoming more irregular.
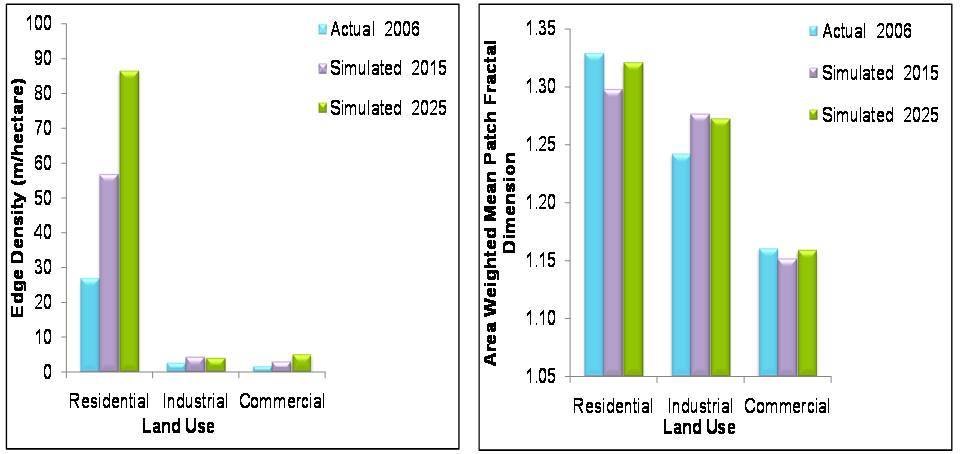
Figure- Edge Density (a) and Area Weighted Mean Patch Fractal Dimension (b) for different Periods and Land Use