GIS and Remote Sensing Application for Mining Development and Its Impact on Urban Sprawl
This article is showing the application of remote sensing data in finding relation between commercial development and urban sprawl. In this work, natural resource excavation as calls mining mapped and also find harmonic relationship with urban sprawl.
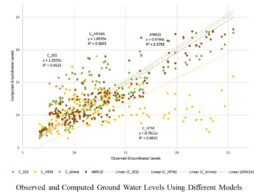
Mapping done by remote sensing can be integrated with mathematical and statistical modeling to know the future changes.
Makrana Mining Area
Makrana is located at 27°03′N/74°43′E-27.05°N/74.72°E. Makrana is a town in the Nagaur district of Rajasthan state of India. It has plenty of marble outcrops. It is famous for the white marble mined from the mines around it.
It has an average elevation of 408 meters (1338 feet). The marble mines are located in the vicinity of the Makrana city. So these are directly affecting the human environment of the city. Therefore it is an interesting location for assess the influence of mines on urban sprawl.
This area has vast marble deposits which are providing opportunities to lots of people to grow. So it is an area which has plenty of prospects to study the impact of mining on land use change with special attention on urban sprawl.
Marble mines of Makrana city which is part of Nagaur district of Rajasthan. These mines have one of the world best deposits of marbles. Makrana marble is a metamorphic rock having 90 to 98 percent CaCo3. Makrana has various mining ranges, popularly known as Doongri, devi, Ulodi, Saabwali, Gulabi, etc.
Mapping through Remote Sensing
In this example, the assessment of influence of mining on urban sprawl has been done using Landsat satellite data. It includes pre-processing of satellite data, visual and digital interpretation and change detection analysis.
Landsat digital data of September 1972, October 1989, October 2000 and February 2003 were used to evaluate the changes in the study area.
Process
The remote sensing satellite data provide useful information about the trend of urbanization as well as for mining in this study area. Remote sensing techniquehas been used to demonstrate the dynamic phenomenon like urban and mining. These spatial data have been analyzed for defining the relationship between urbanization and mining.
Image processing software is used for the classification of the satellite images. The satellite data were checked thoroughly before classification into land use groups and their respective range of reflectance values.
Spectral signature charts were prepared to distinguish and find out the differences in pixel values of different land use classes in different bands. At first, the maximum likelihood algorithm of supervised classification was used for forest, agricultural, barren land, and water classes.
For this, the algorithm was trained by training samples to perform the supervised classification.
CASE STUDY-Assessed Impact of Mining on Urban Sprawl
Increase in urban and mining of marble has clearly seen in the last 30 years. There is significant increase in during this period. The temporal satellite data represents the degree of increase in mining as well as in urban.
The urban of Makrana city was concentrated only in the city peripheral in 1972 but gradually the urban increase on the periphery. The built up patches near to mining site is gradually increased from 1972 to 2003.


There is considerable increase in urban and mining area during this period. Rural area near to city in 1972 is gradually converted in to urban area in the year 2003. Urban sprawl increased by 109.57 ha during 1972-89, 103.15 ha during 1989-2000 and 126.79 ha during 2000-03.
Urban area increased by 339.52 ha during 31 years from 1972-2003.
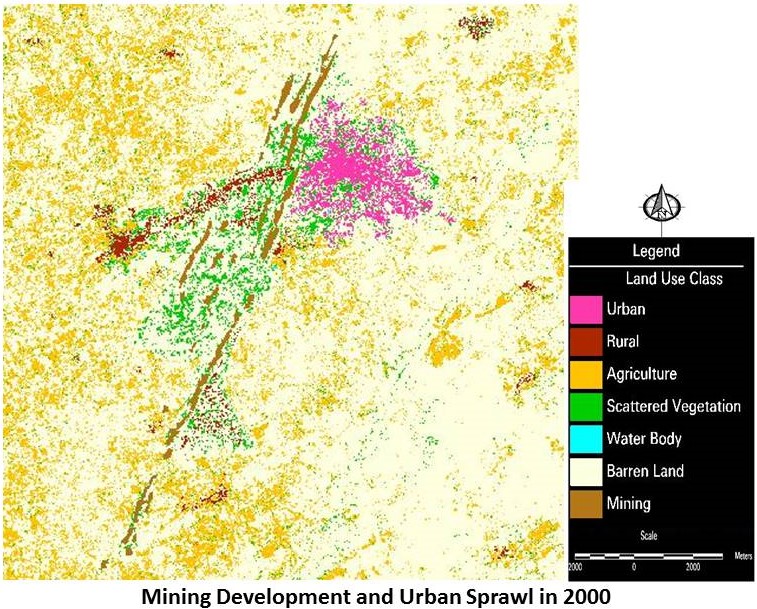

Mining area has changed by 25.0173 ha during 1972-1989, 58.8069 ha during 1989-2000 and 65.1078 ha during 2000-2003. Total change in mining area during 1972-2003 is 148.932. So the annual increase in mining area is 4.84 ha from 1972-2003.
It can be understood from the above process that remote sensing technology is important process through this natural resources mapped. The impact on natural resources can be assessed using remote sensing process,
it can also categorized whether it is natural impact or anthropogenic impact. Therefore it can be defined that remote sensing system is very powerful for analysis.