Geo-Spatial Technology for Wetland Mapping- Explanation with Case Study

Remote Sensing and GIS in Wetland Mapping

Wetland mapping provides useful and important information for assessment of water resources and also for conservation and management of wetland. 

Remote Sensing and GIS techniques have huge potential for mapping, monitoring and assessment of wetland resources. There are better options to the users for wetland mapping, due to advancement in remote sensing and GIS technologies. 
As variety of remote sensing images are available with better and finder spatial and temporal resolution. As well as stereo satellite images are also available for effective and accurate mapping and estimation. 
These high resolution and stereo images can be used to wetland database and integrated with GIS for further analysis such as change simulation, scenario based predictions for better planning and monitoring. 

Wetland Mapping Process through Remotely Sensed Images 

In the study the wetlands of Rajasthan falling in different ecological regions ranging from humid to hot arid western zone have been studied, vis-à-vis the vegetation growing season to analyze the impact of growing period over the aquatic vegetation and level of turbidity. 
In this case study, four districts viz. Sawai Madhopur, Tonk, Pali and Udaipur have been selected on the basis of their different ecological regions for the comparative study of wetland types. 
Various types of wetlands are identified and delineated using satellite data IRS (LISS III) of post monsoon period i.e. Oct./Nov. of 1999. Image processing steps followed for wetland mapping, which start from geometric and radiometric corrections. 

Images are enhanced using enhancement tools such as atmospheric corrections, brightness and contrast adjustment as well as some other tools linear enhancement, piece wise linear stretching etc. are also applied to improve the quality of satellite image. 

                                             
Images were classified using supervised classification method and post classification assessment performed to assess the accuracy of classified images. 
Wrongly classified pixels can be corrected based on secondary and field data by using tool such as sieve, recode/reclass etc. available in Erdas image processing software. 
Apart from this various classes of wetlands were generated using different turbidity level and aquatic vegetation. Land use /land cover is classified adjoining the wetland for assessing the possible impact of land use on the wetlands.


Analytical Assessment based on Wetland Mapping using Remote Sensing Data 

The distribution of various wetland classes indicates that in Tonk district wetland area is high (2.04 %.), so diversity of aquatic flora and fauna is more. The land use/land cover adjoining the wetland is classified for assessing the possible impact of land use on wetland. 

Result shows that forest area is significantly large in Sawai Madhopur (14.04 %) and Udaipur district (25.95 %), while the relative proportion of forest area both in Tonk and Pali district is less than 5 % and major portion is open type. 
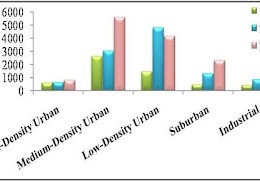
The better forest cover in Udaipur and Sawai Madhopur district could be due to better rainfall amount and distribution and vegetation growing period of more than 90 days.


The arable land is highest in Pali (60.14 %) resulting in less abundance of wastelands (33.21 %). And turbidity level is high in Sawai Madhopur (0.78 %) due to development of wetland over thick alluvium formation. 
Comments 1
Leave a Reply

Your email address will not be published. Required fields are marked *

Prev
Geo-Spatial Technology for Wetland Mapping

Geo-Spatial Technology for Wetland Mapping

Inland Wetland Environment  Wetlands refer to lowlands covered with shallow

Next
Digital Image Processing-Introduction to Image Classification

Digital Image Processing-Introduction to Image Classification

Introduction to Image Classification Classification is a simple process to

You May Also Like