Introduction
GIS is a versatile tool and can be used for variety of application as well as creation of spatial data. It can be used to create elevation data, population density, water quality, urban density, air quality etc. and at the same time these data can be spatially represented.
The advantage of GIS spatial data, that it can be analyzed to assess the impact on neighborhood or surrounding environment. GIS has various functions,spatial data in both formats such as raster and vector.
Here in this article GIS is used to create distribution of commercial and industrial activity within the city to find out the impact on travel demand. For this a spatial data named land use mix created using GIS spatial analytical tool.
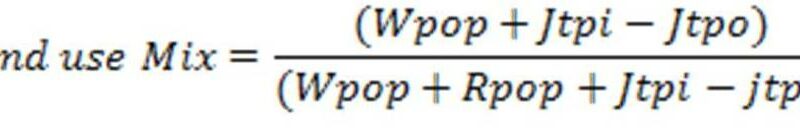
Land use mix index is used to ascertain the level of commercial activity in each ward of Jaipur city. This indicator is very important to know the level of commercial and industrial activities (in the form of
At present, there is no available data source that provides the degree of non-residential activities for a ward of Jaipur city. In this study land use mix index has been created by using worker and non-worker population and number of person travelling for job/employment data at ward level.
The survey analysis report of CMPJ (2008) is used to get a percentage of the job travel (services and employment trips) for Jaipur city. Worker and non-worker population is projected using census data of 2001. Land use mix index has been calculated using the formula in below Equation.

where
Analytical Interpretation
Typically, land use mix show that people living in suburban and rural–residential areas (e.g. villages near to suburban/outskirt of the city) have more job travel. A ratio of 1:1 of land use mix indicates the equality of non-residential/commercial and residential activity.
Low land use mix levels, i.e. residential areas that are segregated from potential work while the high level land use mix indicates higher level of non-residential/commercial activities. In our calculation land use mix index ranges from 0 to 1.
The land use mix value divided in low, medium and high using natural interval/breaks of land use mix value. The wards which, exhibit value less than 0.45 are categorized in low, in 0.45-0.65 range defined as medium and more than 0.65 categorized in high in this land use mix.
The wards that exhibit less than 0.45 values are categorized as the low for the year 2009 and most of the ward exhibit low level of land use mix. Only few ward exhibit medium land use mix value in 2009 (Figure 1).

There is high increase in land use mix in 2031 from 2009 of Jaipur city. In 2031, most of the wards exhibit medium level land use mix and only few wards have high land use mix value. One ward has low level land use mix value in 2031 (Figure 2).

GIS not only used to assess the current scenario as well as future scenario can also be created and analyzed.
Thanks for sharing a useful info. I would also suggest for Data Science course with Real time experience
Excellent work done by you once again here. This is just the reason why I’ve always liked your work. You have amazing writing skills and you display them in every article. Keep it going!
data scientist training and placement in hyderabad