Geo-Spatial Technology in Urban Sprawl and Watershed Study

Remote sensing and GIS combined to used for mapping, monitoring, planning and management for better and sustainable development of city, state and country. 

There are many process in GIS and remote sensing, which can be used for creation of raster and vector database. 

These data can be integrated with mathematical and statistical models/methods for planning and management.

Remote sensing images can be acquired temporally and in different bands for preparation of information in qualitative and quantitative with more accuracy. Different image processing methods can be adopted for creation of raster database. 

GIS can apply to various fields for database creation, analysis, monitoring and planning using vector based analysis. GIS has many functions which can be used to create spatial and non spatial database

In this article, application of remote sensing and GIS explained to understand the impact of urban on watershed.

Watershed 

In a natural watershed environment, structural changes of the watershed and their ecosystems are relatively slow (except under the condition of natural disasters such as fire, drought, and flood). 


However, human activities have vastly altered the structure of these natural watersheds and their ecosystems through accelerated conversion of forest land and wetlands by urban sprawl and agriculture, excessive application of fertilizers and pesticides, vast modifications of hydrological pathways, and concentrated industrial development. 

Human induced urban sprawl (including type, magnitude, and distribution) are the most important factors influencing natural resource management at local, regional, and global scales.

Watershed runoff modeling for Urban Sprawl

Effective watershed management and ecological restoration require a thorough knowledge of the hydrological processes going on in the watersheds. The influence of urban sprawl on catchment water balance is a priority in hydrological study because such change influences land-use type, alters surface runoff generation and then affects the catchment hydrological process. 

Hence, watershed modeling helps us in understanding, predicting, and managing water resources in terms of the flow and quality of water. Watershed modeling also involves a comprehensive examination of contaminant transport across different features found on the surface and in the subsurface. 

The soil and Water assessment Tool (SWAT) for Watershed Modeling

SWAT is a river basin scale model developed by USDA (United States Department of Agriculture) to predict the impact of land management practices on water, sediment and agricultural chemical yields in large complex watersheds with varying soils, land use and management conditions over long periods of time. 

SWAT can analyze both small and large watersheds by subdividing the area into homogeneous parts. As a physically-based model, SWAT uses hydrologic response units (HRUs) to describe spatial heterogeneity in terms of land cover, soil type and slope within a watershed.


Hydrological Component of SWAT


The Simulation of the hydrology of a watershed is done in two separate divisions. One is the land phase of the hydrological cycle that controls the amount of water, sediment, nutrient and pesticide loading to the main channel in each sub-basin. Hydrological components simulated in land phase of the Hydrological cycle are canopy storage, infiltration, redistribution, evapo-transpiration, lateral subsurface flow, surface runoff, ponds, tributary channels and return flow. 

The second division is routing phase of the hydrologic cycle that can be defined as the movement of water, sediments, nutrients and organic chemicals through the channel network of the watershed to the outlet. 


In the land phase of hydrological cycle, SWAT simulates the hydrological cycle based on the water balance equation.


Where, SWt is the final soil water content (mm), SWo is the initial soil water content on day i (mm), t is the time (days), Rday is the amount of precipitation on day i (mm), Qsurf is the amount of surface runoff on day i (mm), Ea is the amount of evapo-transpiration on day i (mm), Wseep is the amount of water entering the vadose zone from the soil profile on day i (mm), and Qgw is the amount of return flow on day i (mm).


Watershed modeling using SWAT is described in four steps

  • Model Set-up
  • Model calibration and validation
  • Model evaluation
  • Sensitivity Analysis

Model set-up

The model set-up involved following steps:
(1) Input data preparation;
(2) sub-basin discretization;
(3) Slope categorization;
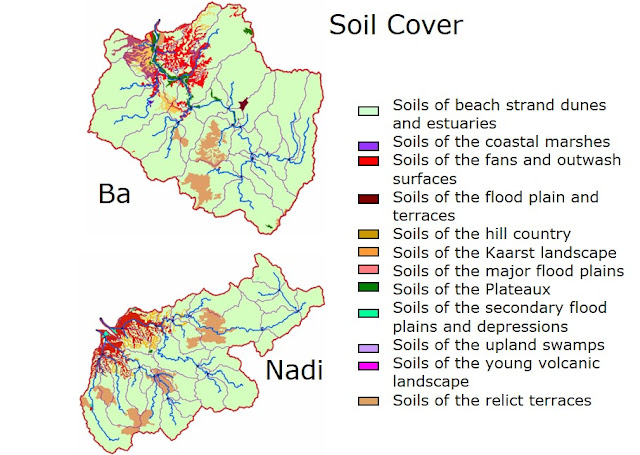
(4) Land use and soil cover definition;
(5) Hydrological Response Unit identification;
(6) Weather data definition;
(7) SWAT simulation;

SWAT incorporates some of the most common hydrological equations for the simulation of flow. For the accurate implementation of the equations, detailed input data are needed. The DEM of the watershed, the soil and land use data and the climate data of the area are what make the simulation so valuable. The DEM is used to delineate the watershed and sub-basin parameters. 

The land use, soil and slope dataset are also linked with the SWAT databases. It Subdivide the sub watershed into hydrological response units (HRU’s), which are areas having unique land use, soil and slope combinations makes it possible to study the differences in evapo-transpiration and other hydrological conditions for different land covers, soils and slopes.


Model calibration and validation

The SWAT model should be calibrated and validated for the study watershed on a daily time step. This can be done by comparing the calculated stream flow with the measured stream flow. Sensitivity analysis is useful for identifying influential parameters and to evaluate the effect of parameters on the performance of the SWAT model in simulating discharge and to limit the number of parameters for calibration.


Sensitivity Analysis

Sensitivity analysis is usually used to measure the effect of parameters on the output. The major objective of sensitivity analysis is to determine which inputs contribute the most to output variation and also which parameters are most highly correlated with the output. 

In order to perform sensitivity analysis of parameters in simulation a single parameter perturbation approach can be used, wherein a range of values between minimum and maximum ones for one parameter is used, whereas values of other parameters remained unchanged during simulation.

Model evaluation

Coefficient of determination
The performance of the model for simulating discharge is evaluated graphically by linear regression (coefficient of determination). The coefficient of determination (r2) describes the strength of the relationship between the measured and simulated values. It varies from 0.0 to 1.0, with higher values indicating better agreement.

Nash-Sutcliffe Efficiency coefficient
The ENS coefficient ranges from negative infinity to 1, and calculated using below equation given by Nash and Sutcliffe in 1970.

Where n is the number of stream flow values, Qsim and Qobs are the simulated and measured values of stream flow respectively, and Qavg is the average observed discharge over the simulation period. Generally the model is deemed perfect when NS is greater than 0.75, satisfactory when NS is between 0.36 and 0.75, and unsatisfactory when NS is smaller than 0.36. 
Comments 2
  1. Very good article. Good to understand overview of SWAT. You may add some links in the article, like SWAT website. Also maybe in another article describe how QGIS could be used to QSWAT based modelling. Excellent work

Leave a Reply

Your email address will not be published. Required fields are marked *

Prev
How Geo Spatial Technology used for Estimation and Mapping of Land Surface Temperature

How Geo Spatial Technology used for Estimation and Mapping of Land Surface Temperature

Geo-Spatial Technology for Estimating Surface Temperature Remote sensing images

Next
Conferences on GIS and Remote Sensing

Conferences on GIS and Remote Sensing

Conference Name: 5th International Conference on Geosciences and

You May Also Like