Remote sensingis used for change detection and analysis of different earth surface features; it includes both man-made and natural features. These features can be combined in a one thematic map, which can be named as land use/land cover map.
Features which are selected to include in land use/land cover map largely depends upon the objective of work/project as well as satellite image selected for project/study. As spatial and spectral properties of satellite image plays significant role in acquiring satellite imagebased on project/study objective.
In this change detection analysis, multi date satellite images need to use and satellite image should have same season/acquiring date and month. Based on satellite image selection using spatial and spectral properties, level of classification is decided for land use/land cove map.
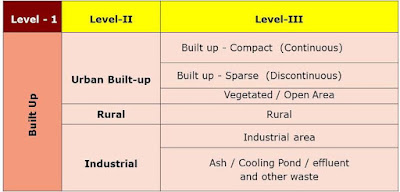
Level of classification can be understood with this example in below figure-

These satellite image will be processed such geometric correct, radiometric correct, image processing such as subset, mosaic etc. than these images enhanced and classified image using supervised or unsupervised classification tools through digital image processing.
Accuracy of these classified images is assessed before getting thematic map. So these land cover and land use maps are ready for change detection analysis.
Change Detection Analysis Explained with Example
The graphical representation of land use and land cover is shown in Figure 2. From the graph it is clearly visible that there is decrease in barren land and water body and increase in built up and agricultural area (inclusion of fallow land).

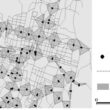
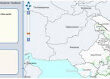
Land use maps displayed in Figures 3, 4 and 5 were prepared using Landsat data of 1975, 1989 and 2002 respectively.

Accuracy of classified data is checked using 400 random samples. The accuracy for 1975, 1989 and 2002 is 89.00%, 95.00, and 93.00% respectively.

The overall Kappa indices for 1975, 1989 and 2002 land use data were 0.91, 0.94, and 0.93 respectively.

Analytical Representation of Change in Land Use and Land Cover
Figure 6 contains land use transition matrix from 1975 to 2002. From this Table we can say that there is an enormous change in land use in 27 years. Built up area is increased from 5101.11 ha. in 1975 to 17193.06 ha. in 2002.
Agricultural area with fallow land also increased during 1975 – 2002. Forest is also increased during 1975-2002 from 32696.73 ha. to 42032.34 ha.
 Figure 6 Land Use Transition Matrix from 1975-2002 (Unit- Hectare)
Barren land is decreased from 717744.9 ha. in 1975 to 420827.4 ha. in 2002. Water bodies are also decreased from 16873.29 ha. in 1975 to 5442.39 ha. in 2002.
thank you so much