Remote Sensing datacan be applicable in many fields as direct use to assess change for monitoring and in many models as input data for further analysis. Selection of remote sensing images to create spatial database is mainly depend on user requirement and these satellite image can be selected for spatial database generation based satellite imagecharacteristics, which can be explained by below parameters of satellite image-
- Spatial Resolution
- Spectral Resolution
- Temporal Resolution and
- Radiometric Resolution
Based on above property satellite images can be selected by user then basic image processing steps need to follow to create accurate spatial data
- Image Geometric corrections
- Image Radiometric corrections
- Image Enhancement
- Image Classification
Accuracy assessment to accept spatial data for further analysis
These spatial data created using satellite images can be used in simulation and mathematical model/method. In this article these spatial data are analyzed using Landscape metrics to assess the urban growth or sprawl.
Landscape metricshas been calculated for different urban classes to ascertain change in their spatial structure, complexity, size and shape using FRAGSTATS. In this article, Land use/Land cover data created using satellite images are in FRAGSTATS tool to calculate different spatial metrics for assessing urban growth patterns. Therefore a case study data is shared below to understand urban sprawl pattern created using spatial metrics.
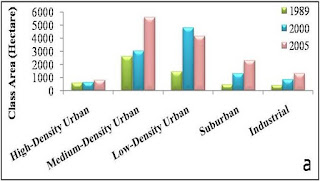
The results of spatial metrics have been displayed in Figure a to e. below figures contain six spatial metric are analyzed in this study.
- Class area (CA),
- Patch density (PD),
- Landscape patch index (LPI),
- Landscape shape index,
- Edge density (ED) and
- Area weighted mean patch fractal dimension (FRAC_AM)
The class area (CA) has shown in Figure a, which indicates the increase in area of different urban classes. In general we can say that there is enormous increase in urban area in all categories during study period. Medium dense urban and low dense urban have maximum urban growth during 1989-2000 and 2000-2005.
The other categories also have huge growth in their area, such as suburban was 462 hectare in 1989 and reached to 2312 hectare in 2005 and industries area was 408 hectare in 1989 and reached to 1329 hectare in 2005.

Patch Density (PD) is explained in Figure b. This indicates that urban classes those are on outskirt of city continuously increasing during study period such suburban and industries, where as classes near the urban centre are increasing from 1989-2000 and then decreasing from 2000-2005 such as high dense urban, medium dense urban and low dense urban.
The increasing in PD in outskirt area of city is enormous such as PD for industries was 0.0455 in 1989 and it reached to 0.2588 in 2005 and same kind of trend found in suburban class.

Landscape patch index (LPI) is having continuous increase from 1989 to 2005 for all urban class instead of medium dense urban class (Figure c). This decrease in LPI for medium dense urban probably affected by the development of discontinuous urban feature in 2000.
The LPI has increased by 267% for sub urban class and 198% for industries, where as LPI has increased for high dense urban by 40% and for low dense urban increased by 53% during 1989-2005.

Landscape shape index (LSI) describes the shape of class or patch. If LSI values are near to 1 then shape is square and if LSI increase without limit then patch types become more disaggregate.
LSI has higher values for all urban classes. This LSI has higher values for urban classes more in low dense urban and sub urban, which indicated disaggregated patches on outskirt of city (Figure d). High dense urban has lowest LSI values, which imply that this urban class has less disaggregate patches.

Edge density (ED) increase always increase with patch and decrease with merging and fusing of patches. ED is increasing for medium dense urban, suburban and industries class and indicated that there is enormous increase fragmentation and development of continuous urban features during 1989-2005 (Figure e).
ED for low dense urban is increased during 1989-2000, which indicates the new urban development and decreased during 2000-2005, which indicates merging and fusing of urban patches. ED for high dense urban decreased during 1989-2000 and then increased in 2000-2005.


Best Landscape Company I am impressed. I don't think Ive met anyone who knows as much about this subject as you do. You are truly well informed and very intelligent. You wrote something that people could understand and made the subject intriguing for everyone. Really, great blog you have got here.
Drainage experts Thanks for taking the time to discuss this, I feel strongly about it and love learning more on this topic. If possible, as you gain expertise, would you mind updating your blog with extra information? It is extremely helpful for me.