Introduction
GIS is an extraordinary tool that can be used for variety of applications. It can used to make harmonic, statistics and analytic relation between two different types of data by incorporation of spatial touch in the process.
GIS gives a platform to create, edit, analyze, predict and scenario based analysis of database for monitoring, planning and management. For example impact of population growth on land use change, anthropogenic pressure on surrounding water bodies etc. can be assessed using GIS and its functions.
Coral health is affected by various factors induced by human and natural. Many factors such as runoff, sediment discharge, water quality and sea surface temperature plays significant role in growth of coral. Thermal stresses can be represented by change in sea surface temperature and these stresses may affect the coral health.
Coral can be categorized based on health as healthy coral, partial bleached coral, fully bleached coral and dead coral. Increase in these thermal stresses can bring changes in the coral health from healthy to partial bleached or fully bleached.
Process Explanation
Different indices created to assess the impact of thermal stresses on coral reef. Three bleaching indices were examined in GIS using simulation results in order to devise a suitable index representing the severity of stress on coral cover owing to increased water temperature. A schematic diagram presenting the method used to calculate these indices is shown below.
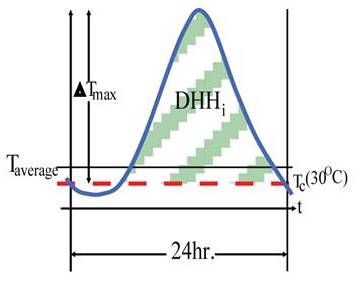
Figure 1
Each index was categorized into different temperature groups to allow better interpretation of the results. In the first scenario, daily average temperature was considered (Figure 2a) by defining four temperature ranges: <=31oC, 31-31.5oC, 31.5-32oC and >=32oC.
The GIS analysis results indicate that partially bleached and dead corals were not well correlated with the daily averaged temperature in MSS or in PAN+MSS. However, these results indicate that fully bleached corals increased and that live coral decreased with the rise in water temperature.
The second scenario included the daily maximum temperature difference and was based on the following expression:
where Tmaxi is the daily maximum temperature difference at the ith location
Tmaxi is the maximum temperature at the ith location
Tc is a critical temperature, assumed to have the value 30oC
To calculate the difference in temperature, the daily maximum temperature was considered at each coral location using 10 minute intervals. Four temperature ranges were defined: <2oC, 2-4oC, 4-6oC and >6oC.
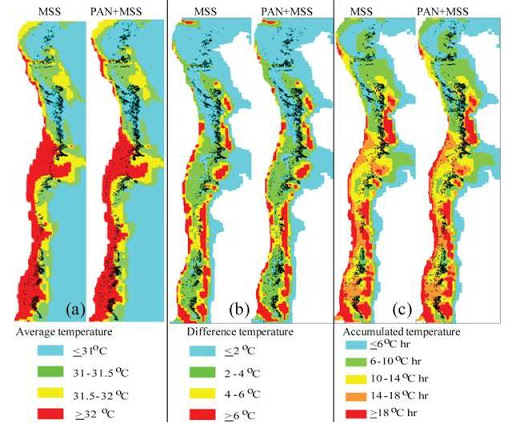
Figure 2
These categories were used to examine the impact of increased water temperature on coral cover (Figure 2b). The results for maximum temperature differences indicate that none of the damaged-coral categories (partially, fully bleached and dead corals) were well-correlated with the change in the daily maximum temperature values.
The third scenario included the daily accumulated temperature (Degree Heating Hour, DHHi), calculated as the accumulated amount of heat according to the following equation:
where DHHi is the cumulative temperature for one day
(specifically, the sum of the positive deviations)
Ti is the temperature at the ith location, using 10 minute intervals
Tc is a critical temperature, assumed to be 30oC
tÌ t* is the time period where Ti>Tc
Five groups of DHH values were defined: <6oC hr, 6-10oC hr, 10-14oC hr, 14-18oC hr and >18oC hr (Figure 2c). Analysis based on these groups indicated that live corals and partially bleached corals showed decreasing trends for both MSS and PAN+MSS data, whereas fully bleached corals and dead corals represented increasing trends.
The results for these three bleaching indices indicate that thermal stress severity could be best interpreted in terms of the daily accumulated temperature occurring during the maximum-SST period of the bleaching season.