Introduction
GIS can be used as planning tool for urban development, transportation planning, land use management etc. GIS provide versatile mathematical and statistical integrated tool for analyzing spatially for proper management. These tools can be used in combination for certain type of analysis and plan accordingly.
There are many areas such as assessment of revenue generation for any city/village in GIS can be used as important tool for better management.
Land management is one of the key concern area for local authority to effectively use and manage.
As single policy and planning may change land cost and its utilization. There are many factors which affect the land management and most of them are location based factors. So GIS is significant tool to manage and restrict use planning for land management.
In GIS many basic methods such as area ratio method, euclidean distance etc. can be integrated to assess the impact of surrounding development and environment on land.
Landscape Development Intensity (LDI) Index
In this post, Landscape development intensity (LDI) index is discussed and explained with real time example as a case study. In this article, watershed is defined as a single land unit to assess the LDI.
The LDI is a land use based index of potential human disturbance. It is calculated spatially based on coefficients applied to land uses within watersheds. These methods are based on the use of a Geographic Information System (GIS) and compatible land use/land cover digital data.
Method
In this article watershed LDI values were calculated using the method given by Brown & Vivas (2005) using GIS tool. Each land use category assigned an LDI coefficient based on cumulative, non-renewable energy input received by each land use type. An area-weighted LDI index was then calculated for each watershed as follows:
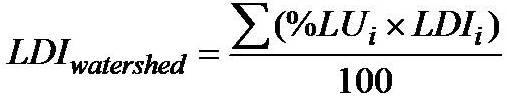
Where, LDIwatershed = LDI ranking for land area (watershed)
%LUi= percent land area in land use i
LDIi= LDI coefficient for land use i
Analysis and Discussion
The LDI values are computed for each watershed during the study period and categorized into seven categories viz. <1.75, 1.75-1.95, 1.95-2.15, 2.15-2.35, 2.35-2.55, 2.55-2.75 and >2.75 to evaluate the human disturbance in Kuroshima island spatially and temporally.
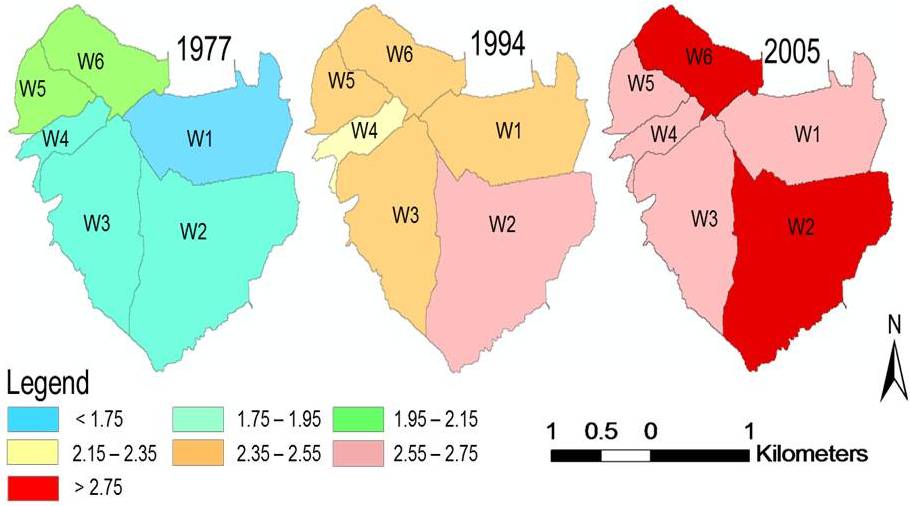
Figure: Spatio-temporal changes in watershed landscape development intensity (1977-05)
Remarks: blue indicates lowest human disturbance and red indicates the highest
The LDI index increases where human activities have increased the land area of impervious surfaces, pastures, built-up and roads. The LDI has been previously shown to capture the cumulative impact of human activities in wetlands and also related with coral conditions at watershed level.
In this article, LDI calculated for three different years (1977, 1994 and 2005) at watershed level to evaluate the impact of landscape development on coral assemblages. The LDI estimated for each of the watershed for three years is shown in above Figure.
The results indicate that Watershed W2, W5 and W6 are more critical watersheds with higher LDI in comparison to other watersheds. These watershed will have more impact on benthic cover and this can ascertain by change analysis relation between LDI and coral condition.
These findings indicate the possibility of landscape development impact on existing coral condition.