In this article ground water discharge/seepage in to coastal ecosystem is discussed. As ground water discharge into the sea water, it brings changes in chemical as well as nutrients properties of sea water.
So Impact of ground water discharge into sea water is assessed using GIS and remote sensing technology to ascertain the affect on coastal ecosystem.
The coastal ecosystems are affected by dissolved nutrient inputs from the circulating offshore water, river runoff, and groundwater seepage. Most of theresearch studies documented that groundwater seepage has a major influence on nutrient levels on the fringing reef in the areas where river input is not significant.
Groundwater indicates higher concentrations of land-derived nutrients than seawater and river water.
To estimate the submarine groundwater discharge, radon monitoring approach is quite promising. The use of radon as an submarine groundwater discharge tracer is related to the fact that radon activity in groundwater is much higher than in surface water and being a noble gas, radon is not likely to be influenced by salinity, redox, and diagenetic conditions present in aquatic environments.
In absence of river discharge, the groundwater discharge can exert a significant effect on reef ecosystem; therefore in the following analysis submarine groundwater discharge was examined using portable radon-in-air monitors.
Some of the conventional approaches (e.g. seepage meters) and weir method are also available to quantify the submarine groundwater discharge, but these methods are tedious, time-consuming and difficult to use in coral reefs where groundwater discharge occurs above sea level during low tides.
Remote Sensing and GIS technology can combined to evaluate the impact of surrounding environment/anthropogenic activity on specific natural phenomena on earth surface. The same concept applied in this article to analyze the impact of ground water discharge on coastal ecosystem.
As it is already understood that GIS has many functions and applications in different fields, which can be used for creation of geo-spatial database. These geo-spatial database can be created either in the raster format or vector format for assessment and analysis. Both geo-spatial data formats are important for such kind of analytical studies.
Remote sensing image used for mapping and change detection analysis of any given area, so in this article coral reef and land use mapped using satellite images for analysis. These thematic maps can be prepared with spatial and temporal variations as per the requirement and integrated with GIS for impact analysis of surrounding environment on natural phenomenon.
Case Study- Kuroshima Island, Japan
In order to qualitatively assess relative groundwater discharge rates from the foreshore, water sampling and in situ water quality measurements (salinity and nutrients) were made around Kuroshima at 40 sampling points with about 300m interval during March 23 to 24, and September 1 to 2 in 2009.
Samples for radon analysis were collected at selected analyzed using RAD7 (a radon-in-air monitor) and RAD-H2O systems, the accessory for radon-in-water measurement.
Total submarine groundwater discharge was computed using radon mass balance and excess radon (Bq/m3) was computed by subtracting the estimates of radium (226Ra)-supported radon. Excess radon is then multiplied by the water depth to yield excess Rn inventory (Bq/m2) for each measurement interval.
Spatial Distribution Assessment Using GIS of Radon and Nutrients
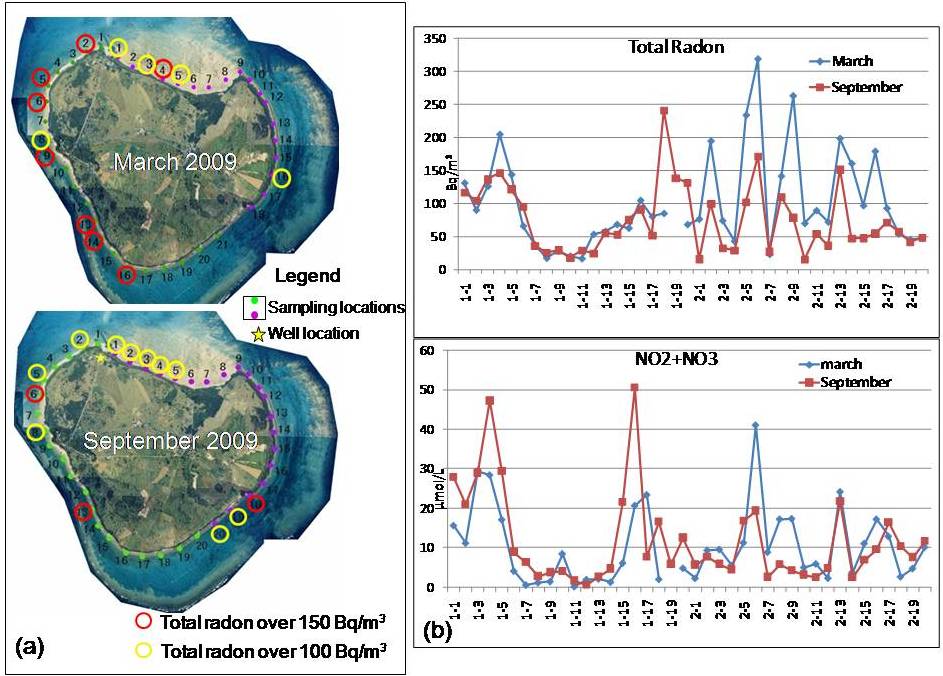
- The 222Rn activity in the nearshore reef ranged from a low of 16 to as much as 318 Bq/m3 at 40 sampling locations around Kuroshima island of Japan during March and September, 2009.
- Radon level was observed very high at sampling point 1-4(204.1 Bq/m3), 2-2 (193.9 Bq/m3), 2-5(233 Bq/m3), 2-6(318 Bq/m3), 2-9(262.3 Bq/m3), 2-13(197.7 Bq/m3), 2-14(159.8 Bq/m3) and 2-16(178.3 Bq/m3) in March 2009.
- However, in September 2009, the radon level was very high at 1-18(240.3 Bq/m3), 2-6(170.9 Bq/m3) and 2-13(151.2 Bq/m3).
- The spatial distributions of radon revealed that groundwater discharge was higher (ranging between 100-150 Bq/m3) particularly in north area,
- West area and south-eastern area of Kuroshima as shown in Figure (a) by red and yellow circles.
- The seasonal distribution of radon indicates not too much difference in the sampling locations except at some sampling locations ranging from 2-1 to 2-17 as shown in Figure (a).
- However, the seasonal distribution of nitrite and nitrate indicates almost same trend except at location 1-4, 1-16 and 2-6 (Figure b).
GIS based Analysis of Database
The nutrient concentration is also indicating the high concentration with correspondence to radon level. Therefore, there exists positive correlation (r2= 0.52) between radon and nutrients.
The groundwater level, salinity and radon were also measured in the well located in the northern part of the island (Figure a).
The well observations indicated that the peak of the water level occurred after the tide; total radon was also very high (355.3 Bq/m3) and salinity was 6.87 psu.
The higher concentration of radon and nutrients indicates the possibility of nutrients discharge impact on near shore reef areas through submarine groundwater.
The findings suggest that groundwater discharge largely controls the nutrient levels in the near shore portion of the Kuroshima Island.