Image Enhancement-Contrast Adjustment
In the last article, learned about the basis concepts of image enhancement and importance of enhancement in satellite image processing.
- Understand satellite image, especially DN values stores in each pixel
- Process in Erdas Imagine to see DN values stored in pixels through viewer Image Info.
- Adjustment of contrast of Image to improve quality
- Image Enhancement Processes
In this article will move further to understand some more process can be used to improve quality of image. But this needs basic understanding of DN value and its range for all bands used in image stacking.
There are some enhancement process are available in all image processing software. Here will discuss enhancement functions of Erdas Imagine software. After displaying a satellite image in viewer of Erdas,
- click on Raster tool from menu bar of Viewer.
- Click on Contrast
- There Select General contrast

in that tool many contrast adjustment options to enhance image. such as
- Histogram Equalization- It is a nonlinear stretch that redistributes pixel values so that there is approximately the same number of pixels with each value within a range.
- Standard Deviation- In this perform a standard deviation contrast stretch on the range of the lookup table.
- Gaussian- It adjusts the range of the Lookup Table (LUT) so the output histogram approximates a Gaussian or normal distribution.
- Linear- In this make the range of the lookup table linear.
- Gamma- It adjusts the range of the lookup table so the output histogram approximates a Gamma distribution.
- Min Max- In this make the range of the lookup table vary linearly from the minimum statistics value to the maximum statistics value.
- Level Slice- Perform a level slice on the range of the lookup table.
- Contrast Value- In this set the output brightness values to a constant value throughout the range.
- Invert- Invert the current lookup table. This has the effect of producing a “photographic negative” of the image.
- Percentage LUT- It Clip a percentage of the Look Up Table from each side of the histogram.
All above option improve the contrast of image by using DN value stored in each pixel. These methods are based on statistical and mathematical operations. It is not necessary that all option will give good results for contrast improvement for that specific satellite image.
Therefore it is necessary to understand the DN values distribution and then apply the specific contrast enhancement tool.
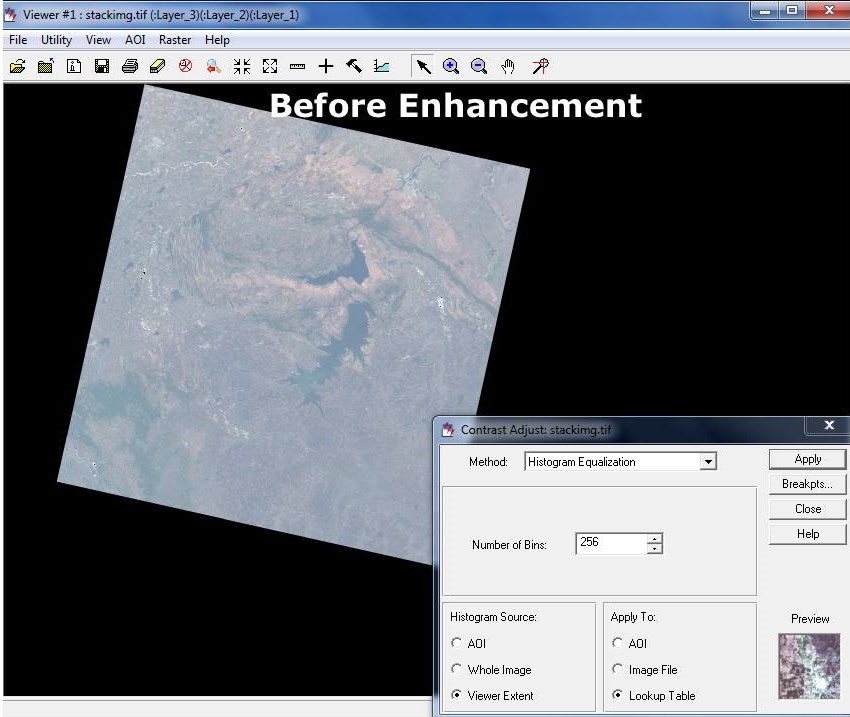
Below is example of Contrast Adjustment
First picture is before contrast adjusted or normal, un-enhanced image
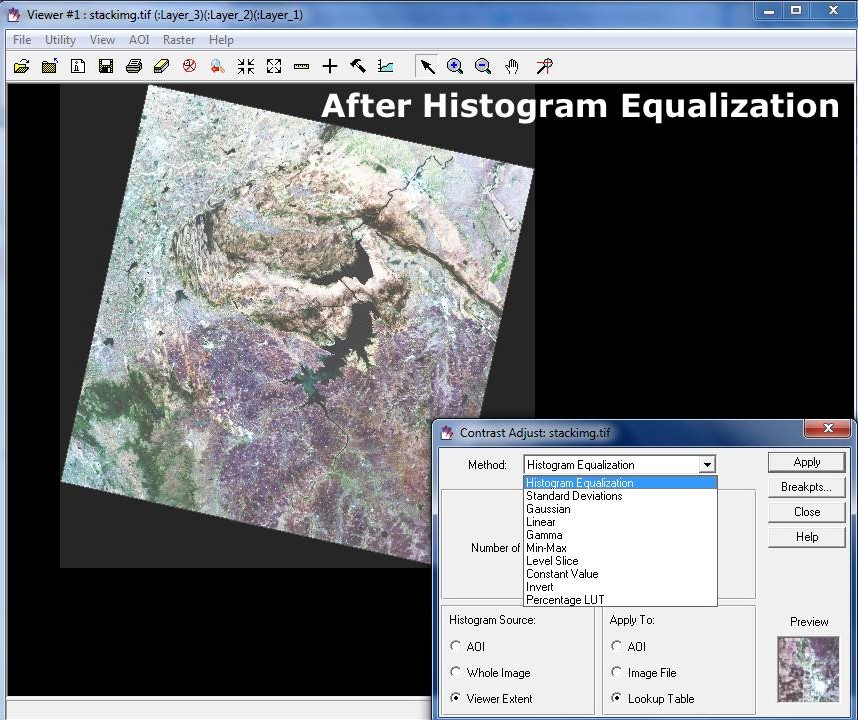
When applied histogram equalization for the above image, difference can be noticed in below figure.
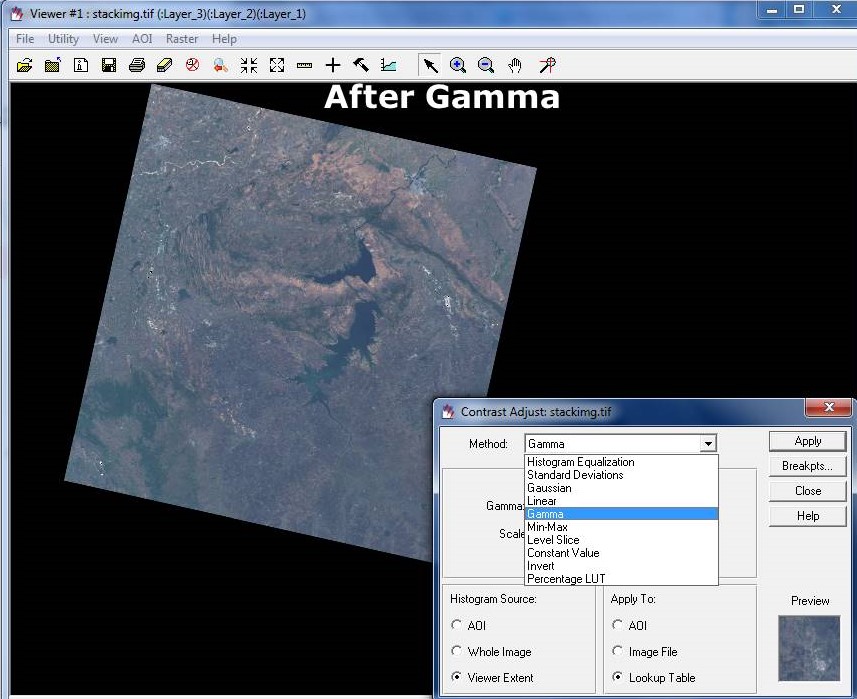
Same normal image if enhanced with Gamma method shown in below figure
Now moving to other option of enhancement, such as piecewise, breakpoints adjustments.
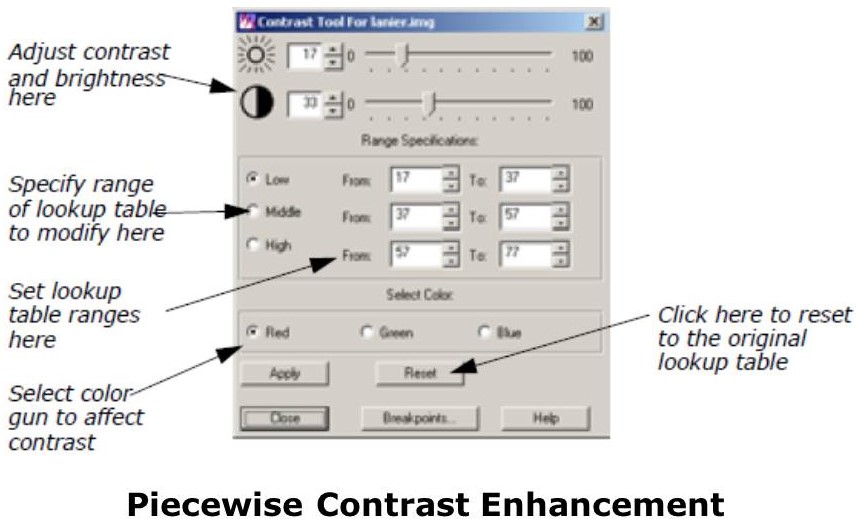
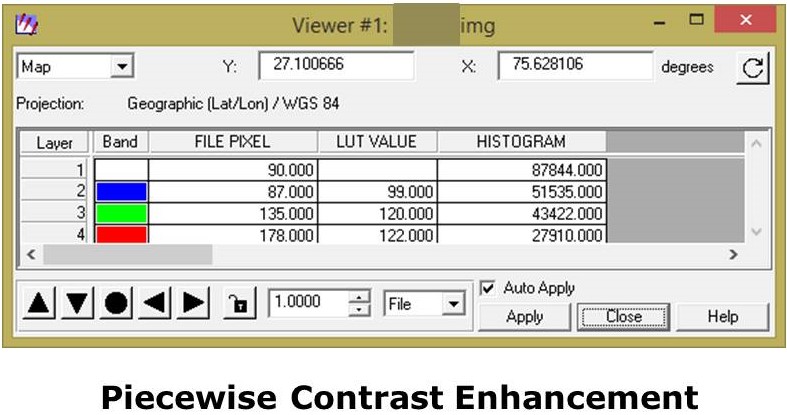
Apply Piece wise Linear Stretches over an image
This tool enables you to enhance a particular portion of an image by dividing the lookup table into three sections: low, middle, and high. You can enhance the contrast or brightness of any section using a single color gun at a time. This technique is very useful for enhancing image areas in shadow, or other areas of low contrast.
The brightness value for each range represents the midpoint of the total range of brightness values occupied by that range. The contrast value for each range represents the percent of the available output range that particular range occupies. As one slider bar is moved, the other is automatically adjusted, so that there is no gap in the lookup table.
This tool is set up so that there are always pixels in each data file value from 0 to 255. You can manipulate the percentage of pixels in a particular range, but you cannot eliminate a range of data file values.
Follow below steps for Piece wise stretches
- In the Viewer menu bar, select Raster
- Contrast
- Piecewise Contrast
- The Contrast Tool dialog for piecewise contrast opens.
- With your pointer over the image in the Viewer, right-hold Quick View Inquire Cursor.
The Inquire Cursor dialog opens and an Inquire Cursor is placed in the Viewer.
For example, In the Viewer, drag the intersection of the Inquire Cursor to the waterbody.
Move the Inquire Cursor over the water visible in the satellite image while keeping an eye on the lookup table values in the blue color gun, as reported in the Inquire Cursor dialog. This gives you an idea of the range of data file values in the water. You can stretch this range to bring out more detail in the water.
- In the Contrast Tool dialog,
- click Blue under Select Color
- Under Range Specifications,
- set the Low range
- and press Enter on your keyboard.
- Drag the Brightness slider bar (the top slider bar) to 50.
- Click Apply in the Contrast Tool dialog.
The water now has more contrast and shows more detail. If your image is at a magnification of 1, this new detail may be difficult to see.
- You can zoom in to a magnification of 2 using the Quick View menu in the Viewer.
- In the Contrast Tool dialog, click Reset
- and then Apply to return the image to the original lookup table values.
- Click Close in the Contrast Tool dialog.
- Click Close in the Inquire Cursor dialog.
Breakpoint for Histogram Adjustmentin an image
- In the Viewer menu bar, select Raster
- Contrast
- Breakpoints.The Breakpoint Editor opens.
- Click the dropdown list at the top of the Breakpoint Editor and select Red.
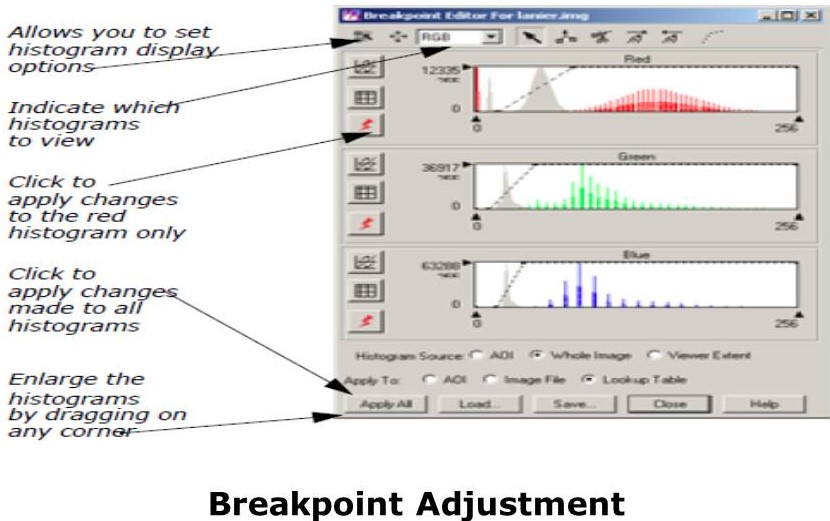
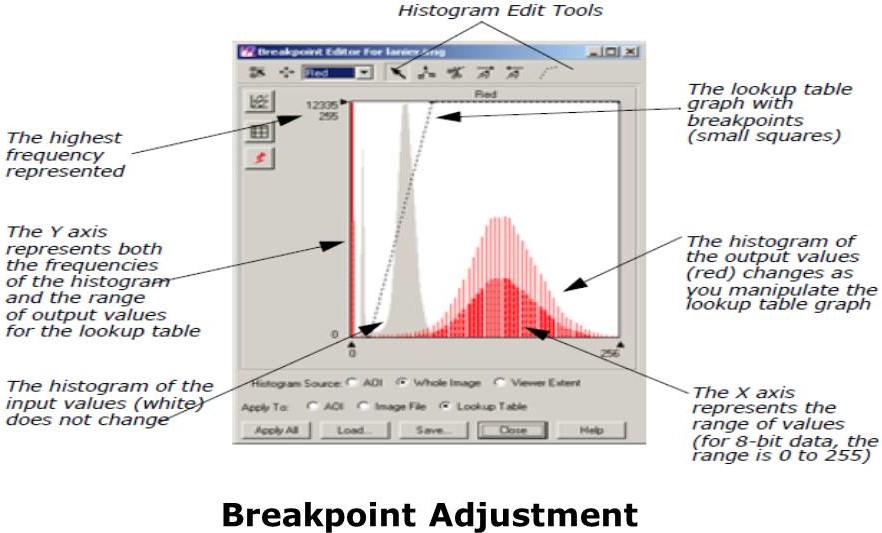
- Each of the three histogram graphics in the Breakpoint Editor can be expanded up to full size by selecting the appropriate histogram from the dropdown list at the top of the Break Point Editor. The parts of the histogram graphic are described in the following illustration.
- Click the dropdown list at the top of the Breakpoint Editor and select RGB. All three histograms re-display in the Breakpoint Editor.
- Experiment by dragging the breakpoints of the lookup table graphs in the different color guns (Red, Green, and Blue).
- Click Apply All in the Breakpoint Editor to view the results of your changes in the image.
- To undo the edits you just made, select Raster Undo from the Viewer menu bar.
In next article will discuss about more enhancement methods for improvement of image quality.
Nice information