Spatial and Temporal Analysis Jaipur & Kota city, India
Image processing and image interpretation for the development of land use/land cover maps was done in ERDAS Imagine software. The classified outputs were studied and analyzed to detect the change in urban sprawl.
The district boundary and city boundary can be created in GIS environment using GIS software.
Process for Spatial Analysis and Temporal Analysis using Remote Sensing Data
Satellite imagery was stacked into different bands to produce a false color composite; the area of interest (study area) was extracted by sub-setting of the image.
Image enhancement techniques like histogram equalization were performed on each image for improving the quality of the image. With the help of Survey of India topographic-sheets of 1:50,000 and city boundary map, the study area has been delineated.
The pre-processed images were then classified using hybrid classification approach i.e. combination of supervised and unsupervised algorithm followed by visual interpretation.
In unsupervised classification method the ISODATA clustering algorithm was adopted, however in the supervised classification technique the maximum likelihood algorithm was used to classify the image based on the training sets (signatures).
The selection of training sets provided by the user based on the field knowledge. The training data given by the user guides the software as to what types of pixels are to be selected for certain land use/land cover type.
The land use/land cover data classified into various classes viz. built-up, cropland, fallow land, scattered vegetation, barren, waterbody, railway, road and airport.
The classification results obtained from supervised classification are re-checked with ground data and other secondary data to find out wrongly classified or missing pixel and these pixels were updated adequately.
The overall accuracy was used to determine the classification accuracy by comparing the classified output with the ground truth locations using Erdas Imagine.
The change detection was then carried out by comparing the areas under each LULC class of the respective years.
All geo-spatial data can be developed into common projection system (i.e. Universal Transverse Mercator coordinate system, zone 43 North, with World Geocoded system-UTM WGS 84) using projection parameters.
Interpreted Spatial and Temporal outcome
Below figures shows spatial and temporal interpreted maps of Jaipur city and Kota city. These interpreted maps can be used directly for monitoring, planning and to assess future prospects.
Jaipur (1989-2016)
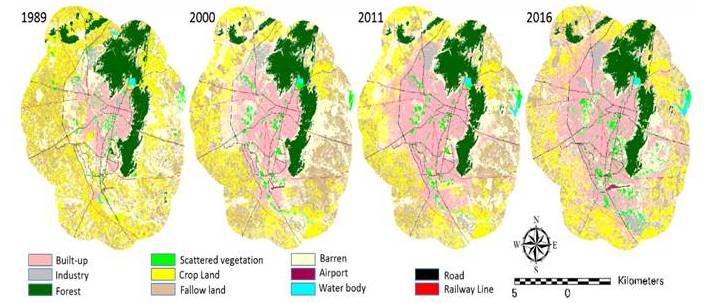 Fig. Land use/Land cover map of Jaipur city
Kota (1989-2016)

Fig. Land use/Land cover map of Kota city